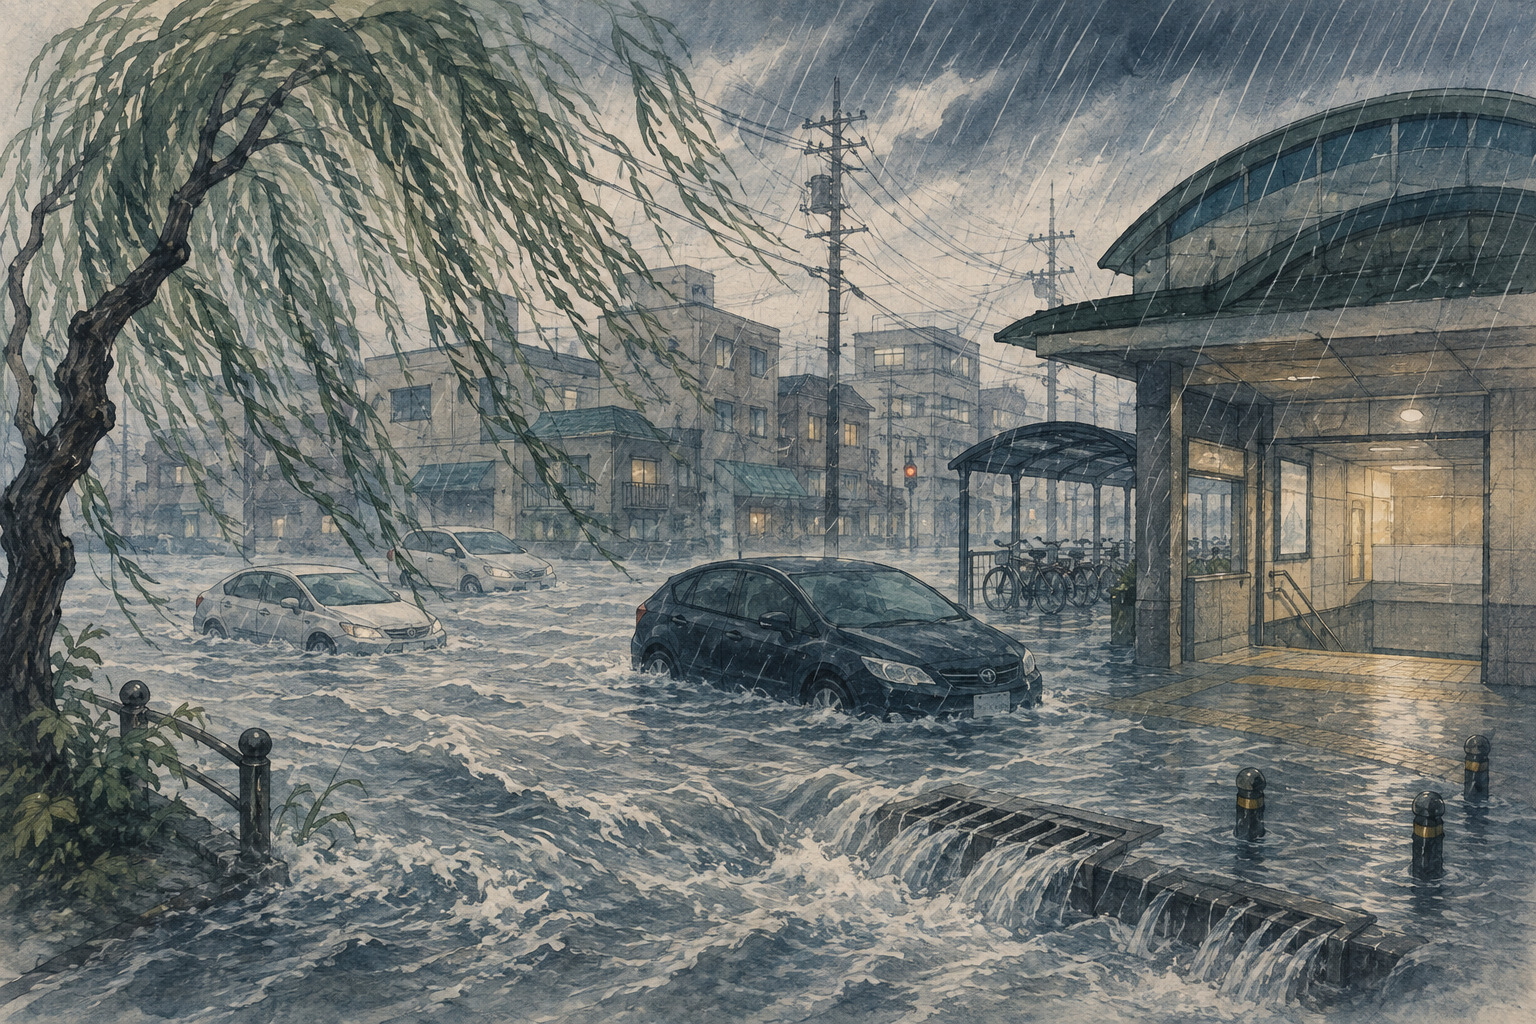
A street can become a reservoir before a river crosses a bank. Rain lands on roofs, parking lots, pavements and roads, then races toward the same low points. If inlets cannot admit it, pipes cannot carry it or the receiving water cannot take it, the excess waits in the city itself.
That is the essential urban problem behind Saitama City’s August 21 deluge. By 7:10 p.m., the municipal government had identified 35 flooded road locations. Twenty-seven were in just two wards: 14 in Minuma and 13 in Kita. Iwatsuki had seven and Nishi one. Three homes had water above floor level—one each in Kita, Minuma and Iwatsuki—and two Minuma homes had below-floor flooding.
The city fire bureau received 15 calls. Ten concerned submerged vehicles or similar incidents: four in Kita, three in Minuma and three in Iwatsuki. Crews made two rescue dispatches connected to vehicle submersion, one each in Minuma and Iwatsuki. No injury had been confirmed when the city released its first report.
The 110-millimeter number needs a label
At 4:33 p.m., the Japan Meteorological Agency issued a kishō bōsai sokuhō for record short-duration heavy rain. It said roughly 110 millimeters had apparently fallen near Saitama City during the hour ending at 4:20. Under JMA’s system, such a figure may come from observation or analysis. In this alert it was an analytical estimate, derived from weather radar and related data.
That distinction prevents two common errors. The figure was not necessarily recorded in a rain gauge. Nor does it say that 110 millimeters fell evenly across the whole city. Convective storms can produce sharp gradients over short distances; the rainfall footprint and its movement are crucial to estimating how much water reached any drain.
The bulletin itself still carries force. JMA reserves this type of alert for short-duration rain of a rarity seen only once every several years, issued when an applicable threshold is met and danger levels have risen under an active warning. It is designed to signal heightened risks of landslides, surface inundation and flooding of small rivers.
Twice the planning benchmark is not twice the overflow
Saitama’s new March 2026 sewer inundation plan says the city has historically built stormwater facilities around 55.5 millimeters an hour, an intensity associated with a rainfall event expected roughly once in five years. The radar-derived 110 millimeters is almost exactly twice that benchmark. It is a revealing contrast—but not a capacity test with a simple pass or fail.
The two figures describe different things. One is an estimated intensity over a particular place and period. The other is a design input used across projects. The water that actually reaches a pipe depends on the storm’s footprint, duration and movement; soil saturation; the share of paved land; slope; inlet and pipe condition; pump operations; storage; and the level of the receiving river. A 55.5-mm design does not mean flooding automatically begins at 55.6. It also does not guarantee safety below 55.5.
A scale calculation helps without pretending to reconstruct the storm. One millimeter falling evenly on one square kilometer equals 1,000 cubic meters of water. An even 110 millimeters would equal 110,000 cubic meters over that square kilometer. That is an illustration only: JMA did not say the analyzed maximum covered a full square kilometer evenly, and this article does not calculate the event’s total volume.
The correct conclusion is narrower. The reported intensity was of a scale capable of placing extraordinary stress on urban drainage. It does not establish that every flooded road resulted from an undersized sewer, poor maintenance or a failed pump. Those explanations require local evidence.
When the river stays inside its banks
Japanese flood planning separates naisui, or inland-water inundation, from gaisui, flooding that escapes a river. Inland water accumulates when rainfall cannot enter or pass through drains, channels and pumps quickly enough. River flooding occurs when water overtops or breaches an embankment. The city’s first report listed road and building inundation but did not report a levee breach, making this event consistent with the conditions of an urban inland flood. That is a classification of the mechanism at a broad level, not a finding about each street.
Urbanization makes the timing harder. Saitama City’s own drainage overview notes that development has reduced land’s capacity to infiltrate and hold rain. A field or unpaved surface absorbs some water and delays some of the rest. A roof or paved parking lot dispatches it rapidly toward an inlet. A drainage network can therefore face a steeper inflow peak even if the rain total is unchanged.
The sewer map is also mixed. Some districts, principally along the Keihin-Tōhoku Line, use combined sewers that carry sanitary sewage and rainwater in the same pipes. Elsewhere, separate systems keep them apart. During extreme rain, toilets and baths may drain slowly or back up. The city advises residents to reduce high-volume household water use during a storm and, if necessary, place water-filled bags over indoor drains. That protects a doorway into a home; it does not replace public drainage capacity.
From heavy-rain warning to Level 4 in 67 minutes
The official timeline shows how quickly the decision window narrowed:
1:28 p.m. — Level 2 heavy-rain advisory.
3:49 p.m. — Level 3 heavy-rain warning; the city began preparing its wind-and-flood disaster warning headquarters.
4:33 p.m. — Record short-duration heavy-rain bulletin, based on the approximately 110-mm analytical estimate for the hour to 4:20.
4:56 p.m. — Level 4 heavy-rain danger warning.
7:10 p.m. — Level 4 lifted; Level 2 advisory in force when the city published its first damage report.
These JMA warning levels are not themselves a municipal evacuation order. They are part of Japan’s reorganized 2026 weather-warning vocabulary. Older reports may use the former phrase “record short-duration heavy-rain information,” while the new official Japanese name is kishō bōsai sokuhō (kirokuteki tanjikan ōame). For a driver or pedestrian, the practical lesson is unchanged: a street can deteriorate faster than a long regional forecast suggests.
Weather reporting by TV Asahi described a highly unstable atmosphere and a convergence of warm southerly and moist easterly winds that allowed active rain clouds to persist over parts of Saitama and Chiba. That is a media meteorological explanation, not a published JMA event-attribution study, and it does not resolve the hydrology of the flooded streets.
Saitama had already changed the map
Only four months before the storm, on April 23, the city published a new inland-water hazard map based on an inundation assumption area designated under Article 14-2 of Japan’s Flood Control Act. The map asks what happens when rain exceeds sewer capacity. Its maximum scenario is severe: 153 millimeters in an hour and 249 millimeters over 24 hours, applied citywide, with high levels in receiving rivers.
That model should not be overlaid mechanically on August 21. The scenario covers the whole city and specifies a 24-hour pattern and river conditions; the 110-mm alert described a localized analytical estimate for one hour. The new map neither predicted a road-by-road outcome nor promised that uncolored areas could not flood. Its purpose is to disclose where water may collect under a defined extreme scenario and to help people test routes and building vulnerability before rain begins.
It also treats only rainfall the sewer system cannot discharge. River-overflow risk belongs on the separate flood hazard map. A resident choosing a refuge or commute route needs both layers.
| Period | Measure or standard | What it does—and does not do |
|---|---|---|
| Historic standard | Stormwater facilities planned around 55.5 mm/hour, approximately a once-in-five-years rainfall. | A planning level, not a sharp boundary between dry and flooded streets. |
| Fiscal 2022 | Aburamen River drainage pumping station completed after work beginning in fiscal 2016. | Forces water into the Kamo River when high Kamo levels prevent gravity drainage; serves a basin of about 3.0 square kilometers. |
| 2023 | Iwatsuki Suwa Park detention basin completed. | Temporarily holds as much as 17,900 cubic meters around Higashi-Iwatsuki Station. |
| March 2026 | New sewer inundation plan incorporating climate-change effects. | Prioritizes districts and layers structural and nonstructural measures over short, medium and long terms. |
| April 2026 | New inland-water hazard map. | Models a citywide maximum scenario of 153 mm/hour and 249 mm in 24 hours; it is not a forecast of one storm. |
Pumps and storage buy time; neither makes rain disappear
Two recent projects show the city’s layered approach. The Aburamen River pumping station, completed in fiscal 2022, can force drainage into the Kamo River when the Kamo is too high for gravity flow. The relevant channel serves a largely urbanized basin of about 3.0 square kilometers. In Iwatsuki, the Iwatsuki Suwa Park detention basin can temporarily hold up to 17,900 cubic meters of rainwater around Higashi-Iwatsuki Station; it was completed in 2023.
Neither facility was built as a citywide shield. A basin delays a local peak; a pump moves water across a hydraulic barrier. Judging their August 21 performance would require rainfall maps, inlet and pipe levels, storage records, pump logs and receiving-river levels on the same timeline. The city’s first damage bulletin does not provide those data.
The longer record demonstrates why such investments exist. During Typhoon Hagibis in 2019, the Saitama Shimbun reported 32 above-floor and 17 below-floor home inundations in Saitama City, along with 38 flooded road sites. August 21 produced a preliminary 35 road locations but far fewer reported home inundations. The numbers are not directly comparable: a typhoon and a localized convective storm have different durations, footprints and reporting cutoffs. They do show that road flooding can recur under very different kinds of rain.
Why cities do not build for an unlimited storm
For decades, many Japanese cities have used rainfall near 50 millimeters an hour as a sewer-planning reference. A national land ministry document notes both the scale of unfinished upgrades and the time and expense of relying solely on new concrete. Designing every pipe, pump and basin for the largest physically imaginable cloudburst would divert extraordinary money and space from other risks—and a rarer storm could still exceed it.
Saitama’s March plan instead identifies priority areas and combines “hard” works with “soft” measures. The city already promotes storage and infiltration at public facilities, permeable pavement, infiltration gutters and household rainwater measures. Its water-level system publishes readings for selected rain pipes, channels and roads, with camera images in some locations. Land use, maintenance, alerts and timely road closure become parts of drainage performance rather than afterthoughts.
The balance is becoming harder. JMA’s Tokyo Regional Headquarters reports a statistically significant increase in one-hour rain of at least 50 millimeters across the Kanto-Koshin region. The recent 2016–25 decade averaged about 0.19 such events per weather station per year, roughly 1.6 times the 0.12 average in 1979–88. The threshold of 30 millimeters an hour rose about 1.5 times.
JMA says global warming may be influencing the nationwide rise in extreme rain, while cautioning that localized extremes are infrequent and the regional AMeDAS record since 1979 is relatively short. Those statistics provide climate context; they do not prove that human-caused climate change produced this particular Saitama storm. Quantifying that contribution would require a dedicated attribution analysis.
A flooded car should not become a depth gauge
Once a road is covered, the driver loses basic information. Water conceals the curb, drains, depressions and displaced manhole covers. Its depth and current can change while a vehicle is crossing. Saitama Prefecture lists 13 underpass flood-warning locations on roads it manages, with signs at all of them and electronic boards or cameras at some.
The prefecture’s guidance is to stay out when flooding is possible and call 110 or 119 if a vehicle becomes stranded. The policy was strengthened after a fatal 2008 underpass flooding in Kanuma, Tochigi Prefecture. The fact that one vehicle has crossed is not proof another can: the water may have risen, and air intakes, electrical components and ground clearance differ.
- JMA risk maps: show where danger from surface flooding, landslides and rivers is increasing—not merely which warning name is active.
- Saitama City water-level system: provides readings from selected rain pipes, channels and roads, plus some cameras.
- Inland-water hazard map: models rain the drainage system cannot discharge.
- River flood map: models overflow from rivers; it answers a different question.
- On the road: do not enter a flooded street or underpass; turn around before the vehicle becomes the measuring device.
The 35 locations are an investigation list
The most useful next document would not simply update the loss total. It would align, for every flooded location, the minute of peak rain; street elevation; inlet condition; pipe level; detention inflow; pump operation; receiving-river level; and the timing of warning signs or closure.
That record can distinguish capacity limits from blocked entrances, local depressions and downstream backwater. Each can put water over the same asphalt, but each demands a different repair. A pipe enlargement will not correct every low road. Cleaning a grate will not solve a saturated network. A pump cannot discharge efficiently if the outlet has nowhere safe to accept water.
The headline lesson is therefore not that Saitama built nothing, nor that one extraordinary number explains every flooded street. The city has pumps, storage, maps, monitoring and a new climate-conscious plan. On August 21, water still accumulated in at least 35 road locations before the urban system could move it away.
Rain cannot be negotiated with. The city can choose where to store it, which bottleneck to enlarge, which road to close first and which resident to warn before the next convective cell forms. Turning 35 preliminary dots into that operating plan is the work that begins after the water recedes.
- Saitama City — first damage report for the August 21, 2026 heavy rain
- Saitama Prefecture disaster-information mail — record short-duration heavy rain bulletin, August 21
- Japan Meteorological Agency — official explanation of the record short-duration heavy-rain bulletin
- Saitama City — Sewer Inundation Countermeasures Plan, March 2026
- Saitama City — stormwater and sewer inundation measures
- Saitama City — inland-water hazard map, published April 2026
- Saitama City — Iwatsuki Suwa Park detention basin
- Saitama City — Aburamen River drainage pumping station
- Saitama City — sewer use and backflow precautions during heavy rain
- Saitama Prefecture — road-underpass flood-warning locations
- JMA Tokyo Regional Headquarters — observed climate change in Kanto-Koshin through 2025
- Ministry of Land, Infrastructure, Transport and Tourism — national stormwater-planning guidance materials
- Saitama Shimbun — 2019 Typhoon Hagibis losses in Saitama City
- TV Asahi — meteorological reporting on the August 21 convergence and storm development
Attribution note: JMA and the prefecture support the rainfall estimate and warning sequence; Saitama City supplies the preliminary damage tally, planning assumptions and facility descriptions. The wind-convergence explanation is attributed to TV Asahi’s weather reporting. The precise cause at each flooded site, the final loss total, the analyzed rainfall footprint and any event-specific climate-change contribution remained unresolved at publication.