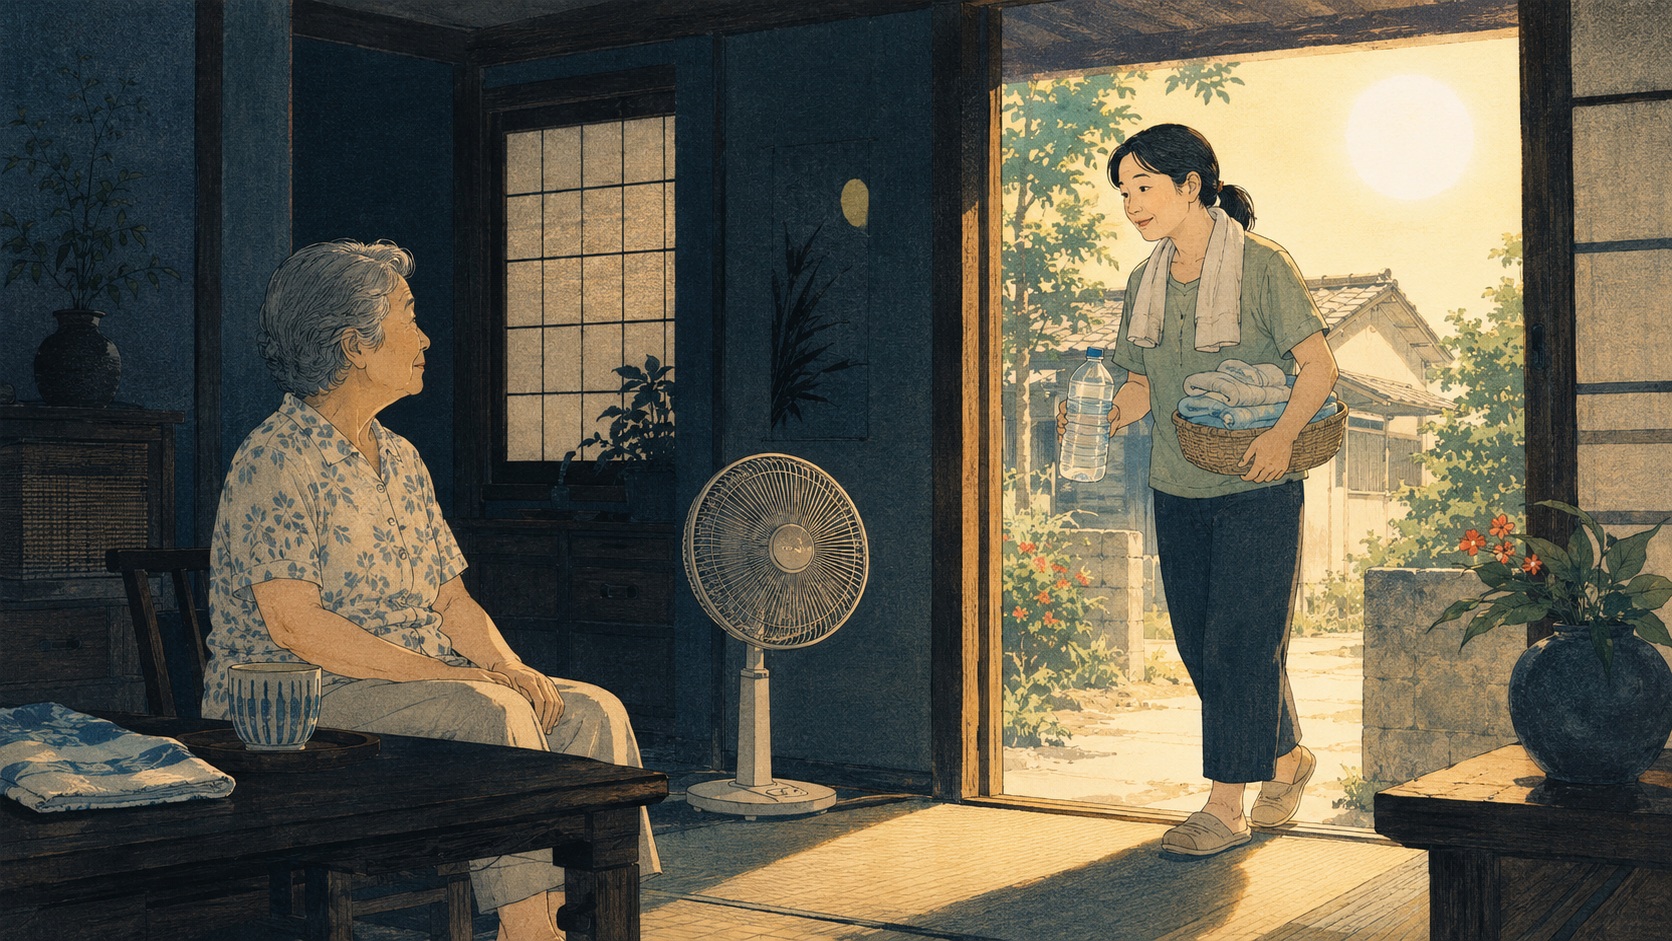
An earthquake announces danger with noise. Shelves fall, walls crack and alerts sound. When a midsummer blackout continues, the next threat can be almost silent. The outdoor air-conditioning unit stops. The fan no longer turns. Walls and roofs that absorbed the afternoon sun release heat long after dark. During the hours when nobody knows whether an older resident stayed home, reached a shelter or found a cooled room, physiological strain can keep building.
A team in the laboratory of Shunsuke Managi, a distinguished professor in Kyushu University’s Faculty of Engineering, and the Fukuoka company aiESG tried to turn that quiet threat into a map and a resource requirement. Their rapid analysis, announced by the university on August 5, concerned the earthquake that struck Kumamoto at 4:27 p.m. on July 28. The Japan Meteorological Agency measured magnitude 7.1 at a depth of 16 kilometers. Uki City and Hikawa Town recorded the maximum seismic intensity of 7.
The team spatially combined satellite observations, census-mesh population, building and shelter information, municipal damage reports and weather observations. Using public damage information available on August 3, it estimated homes that had become functionally unavailable, assigned residents aged 65 and older to those locations, calculated 30 days of cooling demand and modeled the difference in mortality risk with and without effective cooling.
A decimal house is not half a ruined home
The estimate of 303.5 homes looks peculiar because reality does not contain half a house. It is an expected value generated while the precise locations and total extent of damage remained uncertain. The team used building exposure, distance from the epicenter and other inputs to distribute the data across 36,657 census confidentiality-processing groups. Moving from prefecture-wide totals to small spatial units brought the calculation closer to the operational question: Where should cooling be sent first?
“Functional housing loss” is also broader than a formal designation of complete destruction. A building may remain standing but no longer protect health because its power is out, its equipment is damaged, access is unsafe or its residents have evacuated. Disaster-damage certificates take time. A rapid spatial model is meant to build an emergency hypothesis before a complete door-to-door assessment can exist.
Under its central scenario, the model identified 246 affected residents aged 65 or older and a requirement for 34.6 kilowatts of peak cooling capacity and 622.5 kilowatt-hours of electricity per day. The first number describes how quickly heat must be removed at a given moment; the second describes energy supplied over time. They are not interchangeable. Selecting actual generators or batteries would still require assumptions about equipment efficiency, starting current, hours of operation, wiring and resupply.
| Model stage | Information combined | Operational question |
|---|---|---|
| Functional housing loss | Satellite, buildings, municipal reports and location relative to the epicenter | Which homes may no longer provide effective cooling? |
| Older-adult exposure | Census mesh and population in protected small-area groups | How many residents aged 65 or older may be there? |
| Cooling demand | Weather, expected hot days and availability of effective cooling | How much kW capacity and kWh energy should be deployed? |
| Health effect | A transferred temperature–mortality relationship | What relative burden may follow if support is delayed? |
Why 5.34% must not be turned into a body count
A relative risk cannot be converted into a number of deaths without a baseline. If the predicted 30-day death count with cooling is N, the central estimate without cooling would be 1.0534 × N. The release does not provide N in a form that can be recovered from the headline figure. Multiplying 246 by 0.0534 to produce roughly 13 deaths confuses the population with the risk measure.
The range matters as much as the midpoint. Sensitivity analysis extended from 0.67% to 10.01%. The result moves with assumptions about where housing was lost, how older residents were allocated, the number of hot days, the duration of cooling loss and how well a temperature–mortality relationship transfers to this population. Two decimal places describe the output of a calculation, not the certainty of conditions on the ground.
That does not make rapid modeling useless. Emergency managers cannot wait for a perfect registry, complete inspections and verified indoor temperatures. There is a consequential difference between knowing nothing and having a provisional priority map whose assumptions are visible. The model should be used as a starting point for calls, welfare checks, clinical assessment, transport and power deployment—not as a substitute for them.
An aging body may warn of heat too late
The body sheds heat through evaporation of sweat and increased blood flow to the skin. With age, sweating, skin blood flow, cardiovascular reserve and total body water can change, while the perception of heat and thirst may weaken. Heart, lung and kidney disease, dementia, limited mobility and some medications can narrow the safety margin further. None of this makes everyone over 65 biologically identical. Health, housing and support networks vary enormously within that label.
Japan’s Environment Ministry has repeatedly emphasized that older people can develop heat illness indoors and should not rely on skin sensation alone. Ministry material using Tokyo medical-examiner data for 2022 showed that more than four-fifths of heat deaths in the 23 wards were among people 65 or older; among indoor deaths, about nine in ten involved no air conditioner or one that was not in use. That is not a national disaster-mortality rate, but it overturns the comforting assumption that being at home means being protected.
Even in ordinary life, the absence of cooling can overlap with social isolation. A survey of older residents in Misato City, Saitama, in July 2013 found that 96.1% lived in air-conditioned homes. Those without air conditioning tended to be male, unmarried, living alone or in an apartment. A small minority is not necessarily an easy minority to find. If transport, telephones and neighborhood welfare checks fail together after a disaster, it may become the least visible.
The evidence that air conditioning protects—and what it cannot prove
Evidence linking air conditioning to lower heat mortality does not come from a simple randomized trial; deliberately removing cooling would be unethical. A 2020 longitudinal study in Epidemiology analyzed 311 locations in Canada, Japan, Spain and the United States from 1972 through 2009. Rising air-conditioning prevalence was independently associated with a lower risk of heat-related mortality. For Japan, the model estimated that a change in prevalence from 30% to 80% was associated with a 20.3% reduction in heat-related deaths.
Prevalence, however, does not reveal whether a particular person used cooling on a particular night. Housing quality, health care, income, urban design, warnings and behavior change at the same time. Air conditioning is a strong protective measure, but ownership alone is not equitable heat policy. Some people fear the bill, cannot repair a broken unit, cannot operate the controls, dislike cold air or do not recognize that their room has become dangerous.
Disaster opens a wider gap between possession and protection. Grid power may return while wiring inside a building remains unsafe. An outdoor unit may have flooded, fallen or become blocked by debris. A house may be energized but still too dangerous to enter. A utility’s count of zero customers without power is not the same as every vulnerable person having effective cooling.
Kumamoto already knows about deaths after the shaking
Kumamoto has learned that earthquake mortality cannot be counted only in collapsed buildings. In April 2016, the prefecture experienced seismic intensity 7 twice within 28 hours. Its latest ten-year accounting lists 275 deaths: 50 direct deaths and 225 deaths certified as disaster-related. Municipal shelters held as many as 183,882 people; many others slept in vehicles or outdoors, and the last municipal shelters did not close until November 18.
Disaster-related death does not mean heatstroke alone. It includes deaths that municipal review panels connect to the worsening of illness, physical and psychological burden and degraded living conditions. The 2016 disaster began in April, not the depth of a July heat season, so its numbers cannot be transferred directly to 2026. But 225 related deaths against 50 direct deaths made one lesson unmistakable: the rescue clock does not stop after the first minutes.
In July 2018, the recovery from western Japan’s catastrophic rains overlapped with extreme heat. The government issued heat-illness guidance for evacuees and cleanup workers and mobilized generators and cooling. After the 2024 Noto Peninsula Earthquake exposed longstanding weaknesses in shelter conditions, Cabinet Office guidance was revised and the national government repeatedly pressed for air conditioning in school gyms, emergency power and support for people sheltering at home or in cars. Japan’s policy is gradually moving from providing a floor and roof to measuring whether a shelter can sustain health.
1995 The Great Hanshin-Awaji Earthquake makes disaster-related death a central policy concern
2011 Long evacuation after the Great East Japan Earthquake magnifies risk for older people and those with chronic disease
2016 Kumamoto Earthquake: ultimately 50 direct and 225 disaster-related deaths
2018 Western Japan flood recovery overlaps with intense heat, putting heat protection at the center of relief
2024–25 Lessons from Noto drive revised shelter, cooling, power and off-site evacuee guidance
July 28, 2026 A magnitude 7.1 earthquake strikes Kumamoto; intensity 7 in Uki and Hikawa
August 3 Cutoff for public damage information used in the Kyushu–aiESG model
August 5 The university announces the rapid analysis of cooling loss and 30-day mortality burden
What it takes to deliver 34.6 kilowatts
A cooling requirement does not automatically become cooling in a room. Responders first have to decide who can safely remain at home, who should move to a cooled center and who requires medical assessment. Delivering small units to homes can preserve familiar routines, but it multiplies inspections, wiring, fuel and welfare checks. Concentrating people in a cooled public building can use energy more efficiently, but creates transport, infection-control, privacy, caregiving and pet-accommodation problems.
A generator cannot be selected by kilowatts alone. Designers must account for compressor starting current, actual electrical draw, continuous operating time, fuel storage and resupply, carbon-monoxide exhaust and noise. Batteries are quiet and can operate indoors, but need a source of recharge when their kilowatt-hours are gone. Solar plus storage can reduce fuel logistics but depends on weather, clear installation space, intact equipment and enough night capacity. Grid repair and mobile power trucks still need safe building wiring and the last cable to the room.
Cooling also competes with other critical loads. Oxygen concentrators, suction equipment, medicine refrigeration, communications, lighting, water pumps and toilets may all draw from the same source. The model’s 34.6 kW and 622.5 kWh per day are not a purchase order. They are the beginning of a critical-load design.
- Find: Check homes, vehicles, care facilities and general shelters for high-risk residents
- Measure: Record room temperature, humidity and WBGT—not outdoor temperature alone
- Move: Provide safe transport, assistance, medicine and family communication to a cooled site
- Power: Design peak kW, daily kWh, starting load, fuel or charging and distribution together
- Assess: Check cognition, temperature, hydration, chronic illness and medication; escalate to medical care
- Verify: After grid restoration, confirm that the building, wiring and cooling equipment actually work
The latest damage count and the model run on different clocks
Kumamoto Prefecture’s report at 2 p.m. on August 16 listed 39 deaths, 394 casualties in all, 31,728 damaged homes and 3,121 evacuees in 71 shelters. JMA said seismic activity remained active and advised areas that shook strongly to remain alert for earthquakes of intensity 5-lower or greater for roughly a month.
Those latest totals must not simply overwrite the August 3 snapshot that produced 303.5 functionally lost homes and 246 older residents. The prefectural housing count includes partial damage, unclassified cases and estimates. The model’s functional loss is a different concept intended to approximate cooling availability. Ratios built without aligning dates, definitions and geography would produce precise-looking error.
If rapid analysis is to guide operations, each version should preserve its time stamp, input data, assumptions, sensitivity range and later validation. Reports from welfare checks, indoor sensors, outage restoration and building inspection should update the map. Areas where the estimate missed should be disclosed. AI and spatial data can draw provisional lines across an information vacuum; they must not become an authority that displaces field verification.
What the public analysis still does not answer
| What the release establishes | What remains unverified |
|---|---|
| A rapid model combining August 3 data across 36,657 small areas | A peer-reviewed paper, complete equations, code and full input specifications; no publication details are shown |
| A central 5.34% relative increase in 30-day mortality burden, range 0.67–10.01% | The baseline mortality risk, predicted death count or observed outcomes among people who actually lost cooling |
| A central exposure estimate of 246 people aged 65 or older | Differences by age, disease, care needs, living alone, medication and building performance |
| 34.6 kW peak cooling capacity and 622.5 kWh daily energy | Equipment efficiency, operating schedule, starting load, redundancy and distribution specifications |
| A comparison of effective cooling versus no cooling at the same outdoor temperature | How indoor temperature, humidity, ventilation, solar gain, insulation and behavior were represented |
| A framework for finding priority locations quickly | Prospective evidence that using it reduces heat illness, admission or death |
The published figures also contain a unit question. aiESG’s detailed page places Japanese wording that can be read as “per person” after 622.5 kWh per day, while the surrounding explanation presents the number as a resource requirement for the 246-person central scenario. Treating 622.5 kWh as individual daily consumption would also appear inconsistent with the listed 34.6 kW peak. This article therefore treats it as the scenario’s total daily energy. The research team should clarify the wording before anyone uses it for procurement or operations.
Measure restoration in survival, not outage counts
Earthquake preparation has long focused on buildings that stand, furniture that does not fall and roads that remain open. The next step is to design the indoor temperature after systems fail. It is not enough to know that a designated shelter owns air conditioning. Planners need to know how long it will operate on backup power, whether fuel can arrive and who will find residents who cannot reach that shelter.
Linking welfare registries with power and health information raises legitimate privacy concerns. The answer is not unlimited data sharing, but a disaster protocol with a defined purpose, access control, retention period and explanation to residents. Municipalities can prearrange cooled space in schools, care facilities, hotels and commercial buildings, then practice transport and power connections. The hottest day after a quake is too late to measure the cable.
Kyushu University and aiESG’s 5.34% is not a confirmed number of lives lost. Its significance is that, while preserving uncertainty, it converts danger into the language of equipment, geography and time. Earthquake rescue does not happen only under rubble. Deciding whose silent air conditioner must be restarted, how soon and from which power source is rescue, too.
- Kyushu University, “Kumamoto Earthquake: 5.34% increase in 30-day mortality risk when disaster-affected older adults lose cooling”, August 5, 2026. Overview, integrated data and figure definitions.
- aiESG, detailed satellite and population analysis of the 2026 Kumamoto Earthquake. August 3 input cutoff, 36,657 areas, 303.5 homes, 246 people, cooling, electricity and sensitivity estimates.
- Japan Meteorological Agency, 2026 Kumamoto Earthquake portal. Earthquake parameters, continuing activity, outlook and heat-safety links.
- Kumamoto Prefecture Disaster Response Headquarters, damage report, August 16, 2026 at 2 p.m.
- Kumamoto Prefecture, “Ten years after the Kumamoto Earthquake”. Direct and disaster-related deaths, housing damage and evacuation.
- Cabinet Office, policies and guidance on shelter living conditions. Shelter operation, at-home and vehicle evacuees, air conditioning and emergency power.
- Environment Ministry Heat Illness Prevention Information and Central Environment Council material. Older adults, indoor deaths, cooling and welfare checks.
- Fire and Disaster Management Agency, 2024 White Paper summary. A record 97,578 heat-illness ambulance transports in 2024.
- Sera et al., “Air Conditioning and Heat-related Mortality: A Multi-country Longitudinal Study”, Epidemiology, 2020, DOI: 10.1097/EDE.0000000000001241.
- Kayaba, Kondo & Honda, “Characteristics of elderly people living in non-air-conditioned homes”, Environmental Health and Preventive Medicine, 2015.
- World Health Organization, “Heat and health”. Vulnerability of older people and those with chronic disease, and public-health protection.
Editor’s note: This article is an analysis of public material, not medical advice or a calculation of any person’s probability of death. The Kyushu University–aiESG figures are outputs of a rapid model based on information available August 3, not observed deaths. Because the public pages do not identify a peer-reviewed paper, we describe the work as a rapid analysis or model rather than a peer-reviewed study. The 622.5 kWh/day wording is ambiguous in the original detailed page and should be confirmed before operational use. Current damage figures use the prefecture’s August 16, 2 p.m. report. The exchange-rate timestamp supplied by the publisher was converted from UTC to Japan time.