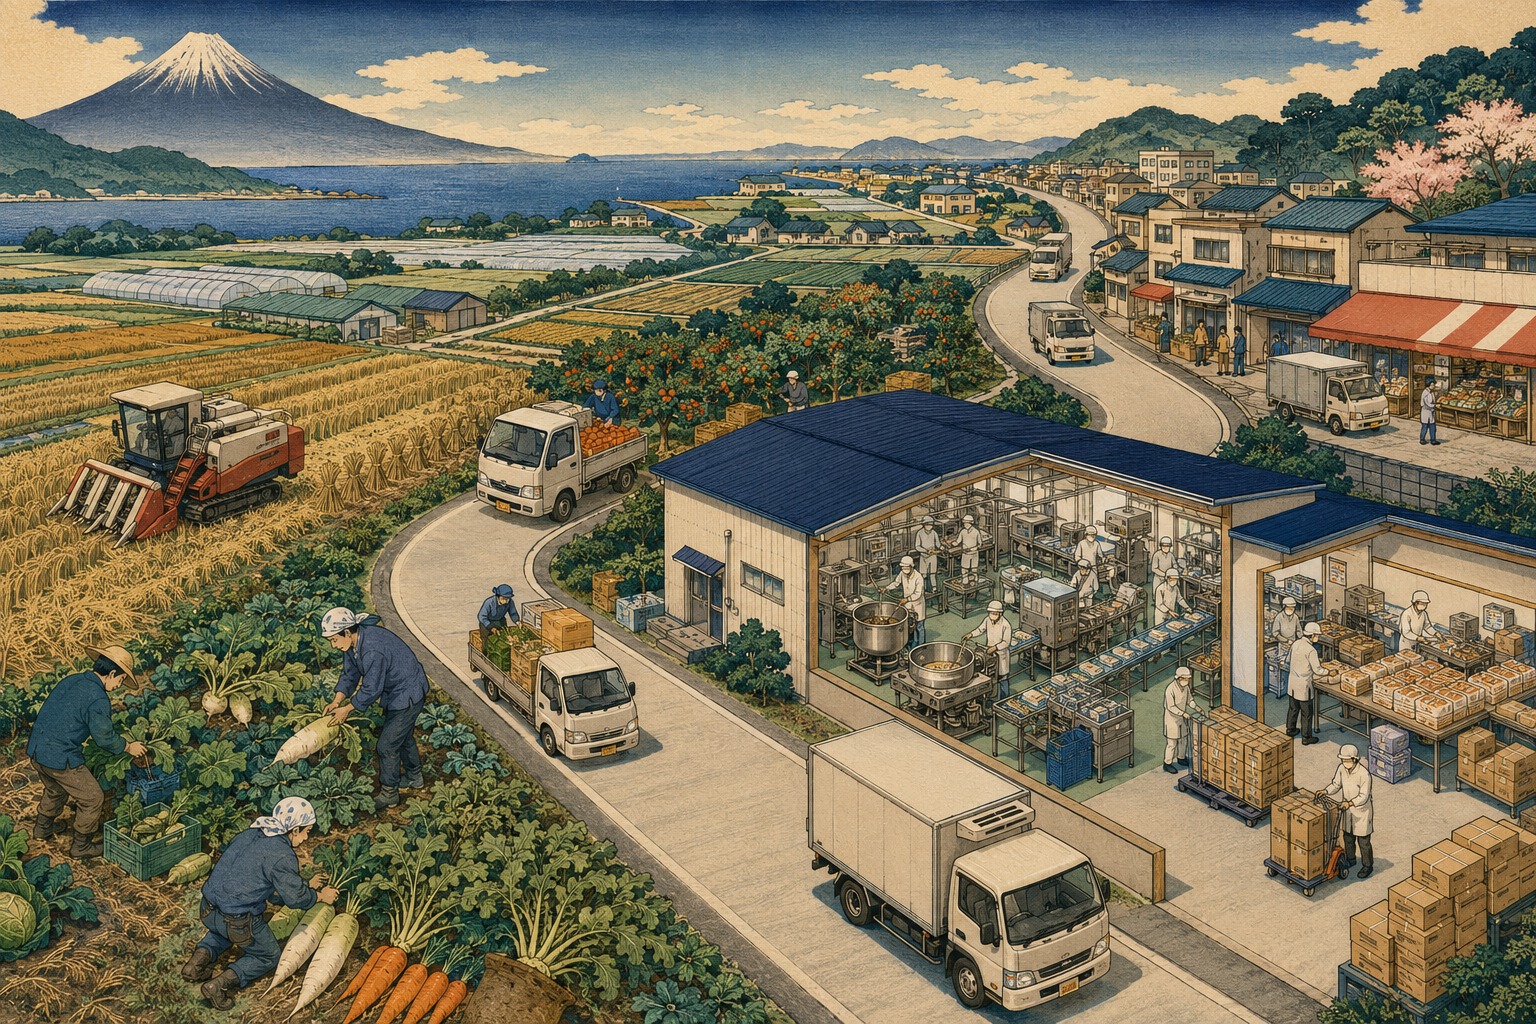
Take one packaged cake from a supermarket shelf. Its price, weight, ingredients, best-before date and nutrition are printed on the wrapper. The climate trail behind it is invisible: fertilizer used for wheat and sugar; land and feed behind eggs, dairy or fats; mixers, ovens and cooling equipment; resin, paper and inks; a warehouse and truck; store lighting; then uneaten food and packaging entering a municipal waste system. A light product can fold a very long journey into one hand.
A carbon footprint of products, or CFP, converts greenhouse gases—including carbon dioxide, methane and nitrous oxide—into carbon-dioxide equivalents according to their warming effect, then assigns them to one unit of a product. It is not a single reading from a meter attached to a factory chimney. At its simplest, an analyst multiplies activity data—kilograms of an ingredient, kilowatt-hours of electricity, liters of fuel, tonne-kilometers of freight or kilograms of waste—by an emission factor, repeats the operation across the lifecycle, and adds the results.
The answer is therefore a measurement and a model. The data may be observed, estimated or taken from a database. The analyst must decide where the system begins and ends, how to divide a shared oven among many products, what consumers normally do at home, and which tiny flows can reasonably be excluded. Those choices are not footnotes to the footprint. They are part of it.
The one company selected had already begun counting
MAFF accepted applications from June 22 through July 31. It considered internal capability, the purpose of the calculation, the target product and willingness to communicate the work. The sole name in the August 14 selection notice was Sun Lavieen, headquartered in Satosho, Okayama Prefecture. The company makes Western- and Japanese-style confectionery and bread, including fruit cake, Belgian waffles and sponge layers for decorated cakes.
Its history reflects the local roots of Japan's processed-food industry. The present business dates to 1980 and grew after an enterprise associated with ironworking in Tomonoura, Fukuyama, shifted into confectionery. It now operates factories in Okayama and Fukuyama. Choosing a regional manufacturer that runs multiple products through shared facilities matters because the ministry says the model should be useful across the industry, including small and midsize businesses—not only corporations with dedicated lifecycle teams.
Sun Lavieen is not starting from a blank spreadsheet. It and Okayama University began a one-year joint research project in December 2025 and announced it in January. The plan is to start with sponge cake and Belgian waffles, expand to roughly 100 own-brand products, explore labels for lower-footprint products, and study what such disclosure does to corporate brand value. The company also says employee-led energy conservation begun in 2022 cut annual energy expense by about ¥34 million and CO2 emissions by about 306 tonnes. Those are company-reported operational savings, not product footprints produced by the new national project and not presented as independently audited figures.
Selecting a prepared company makes it easier to build a detailed case in a short project. It also creates a test of transferability. How many people did the calculation require? Which records already existed? How many suppliers had to be contacted? How much expert time and database access were needed? A role model becomes useful to an ordinary small manufacturer only when it reveals the labor behind the final number, not just the number itself.
The five stretches inside one number
MAFF's Common Carbon Footprint Calculation Guide for Processed Foods uses five basic lifecycle stages for a finished product: raw-material procurement; production; distribution and sales; use and maintenance; and disposal and recycling. The default unit is one sales package, although a unit such as 100 grams may be used when appropriate. The contents, packaging and inseparable accessories, such as a straw and its wrapper, belong within the product system.
| Stage | Examples of data | The hard food-industry question |
|---|---|---|
| Raw materials | Ingredient mass and origin; farming or livestock; initial processing; packaging materials; inbound freight | The same flour or oil can differ by place, yield, fertilizer and process. Can a maker obtain primary data for imported ingredients? |
| Production | Electricity, gas, steam, water, yield, waste, cleaning and cooling | Should a shared oven or building be allocated by product mass, pieces, line time or another physical relationship? |
| Distribution and sales | Distance, mode, loading, warehousing, cold storage and retail loss | Routes, shared loads, return trips and seasons change. How closely does a common scenario describe the real network? |
| Use and maintenance | Home refrigeration, heating, cooking, water and typical consumption | Is the food eaten directly or cooked? Can one representative use be defined? |
| Disposal and recycling | Food loss; packaging separation; incineration, landfill and recycling | Households and municipalities differ. If lighter packaging shortens shelf life, does the total footprint improve? |
In each row, activity data are multiplied by emission factors. If a factory knows only its total gas use, it must allocate that burden among products. The guide gives priority to physical relationships—weight, count, area, volume, calorific value or equipment run time. Economic value can be used when a physical basis is unsuitable. Because the allocation choice can change the answer, the calculation must be documented well enough to reproduce.
Food adds a difficulty that a factory electricity meter cannot solve: agricultural emissions. Nitrous oxide from fertilizer, methane from livestock, land-use change and year-to-year yield variation may occur several suppliers upstream. Formulae, supplier identities and yields can also be commercially sensitive. A product maker may buy from an ingredient processor that buys from a trader that buys from farms. A CFP is therefore an environmental account and a test of how far information and trust can travel through a supply chain.
Why Japan chose a “loose common ruler”
The guide, released in March 2025 and revised in March 2026, describes its approach as low-cost, simple and a “loose common ruler.” That is not a declaration that accuracy does not matter. It acknowledges that if every ingredient, journey and household action must be measured directly, only large companies with specialist staff and budgets will be able to participate.
The guide encourages primary data within a company's control. Where those data are hard to obtain, it permits justified secondary sources such as MAFF's standard factors, IDEA, ecoinvent, an Environment Ministry database, statutory reporting factors and published research. Roughly the latest 12 months of data are preferred so that seasons are represented. Common scenarios can cover distribution, retail or use, then be adapted where company-specific information exists.
Similar SKUs may share calculation logic if the estimated difference between their results is within plus or minus 5 percent. Excluding flows—known as cutoff—is to be avoided. When the effort of collecting minor data is disproportionate, the combined exclusion should generally stay within 5 percent by mass or emissions and must be disclosed. A material with a high emission intensity should not disappear merely because it weighs little.
- Use a justified secondary factor when primary data outside the company's control cannot reasonably be obtained.
- Apply common distribution, retail, use and disposal scenarios, replacing them with company conditions where possible.
- Allocate shared facilities first by physical measures such as mass, count, heat or run time.
- Extend one logic to similar SKUs only after testing the likely difference.
- Record the scope and reason whenever a minor flow is unavoidably excluded.
Every shortcut carries a price. Two companies can choose different databases, years, origins and household scenarios for similar foods. Their results are not automatically comparable. That is why MAFF's guide says it is not intended for comparison with another company's product. If “123 grams” and “118 grams” appear on two packages, the second is not necessarily better. A credible comparison requires the same functional unit, system boundary, product-category rules, data quality and verification conditions.
A company inventory is not a product footprint
Two kinds of climate accounting are often confused. A corporate greenhouse-gas inventory tracks an organization by year: direct emissions under Scope 1; purchased electricity and energy under Scope 2; and indirect sources such as materials, logistics, business travel and the use of sold products under Scope 3. A CFP follows one product unit—one pack, kilogram or liter—through its lifecycle.
If a company changes factory electricity to renewable power, both accounts may be affected. But a company-wide annual reduction of 306 tonnes cannot simply be subtracted from the footprint of a cake. The saving must be connected to the relevant site, process, period and product. Nor should an offset bought somewhere else be deducted from the physical product footprint in a way that hides how it was made. ISO 14067 keeps carbon offsetting outside the quantification of a CFP.
A CFP is not a calorie label and it is not a complete environmental score. It addresses climate change, not water scarcity, biodiversity, pesticides, soil, nutrition or labor conditions. A low-carbon number does not automatically mean healthy, ethical or environmentally superior in every respect. The European Commission's Product Environmental Footprint method examines multiple environmental effects; MAFF's processed-food guide deliberately concentrates on climate.
The history of labels is also a history of caveats
Lifecycle assessment developed as a way to account for resource use and emissions across an entire product system, and the ISO 14040 family codified the framework internationally in the 1990s. In 2007, Walkers crisps became a prominent early product to carry the Carbon Trust's Carbon Reduction Label in Britain. The GHG Protocol published its Product Life Cycle Accounting and Reporting Standard in 2011. ISO 14067 followed in 2018 with internationally agreed principles for quantifying and reporting a product carbon footprint.
These systems are not simply instructions for printing a number. They require a stated purpose, a suitable functional unit, an explained boundary, recorded allocation, data-quality assessment, hotspot identification and a basis for tracking reductions over time. The GHG Protocol product standard is not, on its own, a standard for ranking competitors. Comparative claims need consistent category rules, equivalent data and appropriate review.
1990s The ISO 14040 family establishes the international framework for lifecycle assessment.
2007 The Carbon Trust verifies an early public product carbon-reduction label in Britain.
2011 The GHG Protocol publishes its Product Life Cycle Accounting and Reporting Standard.
2018 ISO 14067 is published as the international standard for carbon footprints of products.
2021 Japan's Strategy for Sustainable Food Systems calls for decarbonization across the food supply chain.
2024 MAFF runs its first processed-food calculation trial with milk and cooking oil.
2025 A five-company, five-product trial tests the approach and a common guide is released.
2026 The guide is revised after work with Morinaga and Kikkoman; Sun Lavieen is selected for the next model in August.
Japan also brings its own history of CFP pilots and environmental declarations. The economy and environment ministries issued national carbon-footprint guidance in 2023. MAFF places its common processed-food guide in relation to that guidance, ISO 14067 and the GHG Protocol, then adds the common scenarios and simplifications needed for the sprawling food sector.
What five very different foods taught the ministry
The present method was not written in one sitting. From January to March 2024, Aeon, Seven & i Holdings and Meiji tested a draft using milk and edible oil. The next trial, from December 2024 through March 2025, involved Aeon, Kagome, Nisshin Seifun Welna, Hanamaruki and Pokka Sapporo Food & Beverage.
The selected products were deliberately varied: crab-flavored fish-paste strips, unsalted tomato juice, household flour, rice-koji miso and a lemon drink. They brought chilled food, a PET beverage, powder and a fermented product under one framework. Companies also had different goals, ranging from an external self-declaration to internal hotspot analysis.
The most practical result was that a calculation could be completed without perfect primary data. Real distribution routes, retail conditions and household behavior were not always available. Common scenarios filled those gaps. In the Hanamaruki case, the trial concluded that freely available databases could support a calculation of comparable quality—important evidence for smaller companies that cannot buy every proprietary dataset or a large consulting engagement.
The trials also showed why the number needs a story. For Nisshin Seifun Welna's one-kilogram bag of flour, analysts modeled four household uses: pancakes, udon noodles, tempura and cookies. The bag was unchanged, but cooking energy and behavior differed. Pokka Sapporo reported that raw-material procurement accounted for more than 60 percent of the footprint of its tested lemon drink. That share must not be copied onto cake, miso or any other food; each product has its own map.
Morinaga Confectionery and Kikkoman joined the fiscal 2025 model, and their experience informed the March 2026 revision. Kikkoman subsequently published a footprint of 122 g CO2e for one 200 ml pack of its unsweetened soy milk. The boundary included the straw and wrapper, and production used 100 percent renewable electricity. Just as importantly, Kikkoman stated that the result had not received third-party verification or certification and was not intended for comparison between products. That warning is part of honest measurement, not an inconvenience to hide.
If packaging gets lighter, does the footprint always fall?
Packaging is the part consumers can see. Thinner film, a lighter tray or a smaller carton can reduce material production and freight emissions. But packaging also protects food from moisture, oxygen, microbes and breakage. If light-weighting shortens shelf life or raises product loss, the emissions already invested in ingredients and manufacturing may be wasted with the food.
That is why a CFP looks across the product system rather than isolating one wrapper. A large pack may use less packaging per gram but cause more leftovers in small households. Individual packs use more material yet may keep unopened portions edible. The answer depends on shelf-life testing, sales patterns and waste rates. The relevant question is not merely packaging per gram sold but the burden per useful amount eaten.
“Food miles” need the same caution. Long travel creates emissions, but transport is not always the largest stage. Farming method, fertilizer, land use, refrigeration and yield can outweigh distance for some products. “Local” is not automatically “lower carbon,” just as paper is not automatically better than plastic in every system. A lifecycle calculation tests those intuitions and finds the large sources instead of assigning virtue to the most visible part.
A vast global system, measured one pack at a time
The Intergovernmental Panel on Climate Change estimated that the global food system accounted for 21 to 37 percent of anthropogenic greenhouse-gas emissions during the 2007–2016 period. The range includes more than farming and land use: storage, transport, packaging, processing, retail and consumption are part of the system. The UN Environment Programme says food loss and waste are responsible for 8 to 10 percent of global emissions. A spreadsheet for one processed food is a small administrative object sitting at the entrance to an enormous climate problem.
Publishing a footprint does not, by itself, reduce those emissions. A calculation focused on factory efficiency can miss a much larger raw-material source. A lower-carbon ingredient can create new problems for biodiversity, water, taste, allergens, safety or price. Carbon is a decision axis, not a verdict replacing every other value in food.
How to prove that the method works for smaller companies
A large producer can assemble procurement, factory, logistics, environment, data and communications teams. At a smaller maker, one person may cover quality assurance and supplier inquiries; utility bills may exist only for the whole factory; recipes may contain shop-floor knowledge; and distribution information may end at the wholesaler. A small buyer may not have the leverage to demand farm-level emissions data. Software, databases, consulting and staff education all cost money.
A useful model should therefore show the minimum route from ordinary records to a reproducible result. Choose the SKU. Draw the process map. Inventory existing data. Fill the important gaps first. Match unavailable primary data to a recommended secondary source. Test whether a change in emission factor or allocation changes the apparent hotspot. Leave enough documentation for a different employee to repeat the calculation next year.
MAFF has not disclosed why it selected only one company in 2026 or how many applied. One participant is not evidence that applications or industry interest were low. A one-company project may permit deeper assistance, but it can also produce lessons specific to one recipe, factory and supply network. The final report will become a model for a broad industry only if it reveals failed data requests, abandoned primary-data efforts, uncertainty ranges, staff hours and outside support—not only a polished success story.
If a number goes on the package, put the legend beside it
The separate Sun Lavieen–Okayama University study proposes examining possible labels for lower-footprint products and their effect on brand value. The national model's target product, label and verification arrangements remain unannounced. If a consumer-facing figure eventually appears, readers should be able to trace at least its unit, boundary, reference year, guide and version, important secondary datasets, household-use scenario and third-party review status.
A reduction claim needs a base year and an explanation of what changed. Did the recipe, supplier, factory equipment, electricity contract, packaging or distribution improve? Did the package merely become smaller? Did a database update create an apparent reduction? A calculation report aligned with ISO and GHG Protocol principles supports a public claim, but it also preserves the internal history needed to repeat the improvement.
- The target product and functional unit, such as one sales pack or 100 grams
- The boundary from raw materials through end of life
- The split between primary and secondary data, including period and geography
- Allocation rules for shared equipment, coproducts and waste
- Excluded processes and their estimated effect
- Scenarios for logistics, retail, household use and disposal
- Uncertainty and sensitivity to changed assumptions
- Staff time, outside support and database cost
- Verification status and the specific reduction decisions produced by the calculation
Use the answer to make the next reduction
The Sun Lavieen project should not be judged simply by the number of SKUs calculated. Could the company update the figure the next year? Did the result change a decision about ingredients, baking, yield, packaging or freight? Did suppliers continue sharing data? Could another product—and another smaller manufacturer—repeat the method at modest additional cost? Ultimately, did emissions fall after the accounting began?
Pick up the cake again. One day, a carbon figure may be printed beside its nutrition. A small figure alone cannot tell the full journey from a field to a waste plant. Trust comes from explaining what was measured, what was estimated and what remains unknown.
A loose ruler is not permission to be vague. It is a promise to make the procedure light enough to use while refusing to conceal the limits of the result. The climate work does not end when one answer is printed. It begins when that answer becomes a map for deciding where to remove the next gram.
Sources and reporting basis
- Ministry of Agriculture, Forestry and Fisheries: participant selected for the fiscal 2026 processed-food CFP model (August 14, 2026)
- MAFF: call for fiscal 2026 model participants (June 19, 2026)
- Sustainable Management Promotion Organization: model-project application information
- Okayama University: joint CFP research with Sun Lavieen (January 15, 2026)
- MAFF: food-supply-chain decarbonization and the Common CFP Calculation Guide for Processed Foods
- MAFF: Common CFP Calculation Guide for Processed Foods (revised March 2026)
- MAFF: results of the first processed-food CFP calculation trial
- MAFF: fiscal 2024 processed-food CFP trial results (April 23, 2025)
- MAFF: five-company, five-product calculation trial report
- MAFF: Morinaga Confectionery and Kikkoman selected for the fiscal 2025 model
- MAFF: fiscal 2025 model results and revised guide (March 18, 2026)
- Kikkoman: CFP of a 200 ml pack of unsweetened soy milk
- Nisshin Seifun Welna: CFP trial for a one-kilogram bag of household flour
- Ministry of Economy, Trade and Industry: Japan's carbon-footprint guidance and support
- ISO: ISO 14067:2018 — Greenhouse gases — Carbon footprint of products
- GHG Protocol: Product Life Cycle Accounting and Reporting Standard
- European Commission: Product and Organisation Environmental Footprint methods
- Carbon Trust: history of product carbon labels
- IPCC: Climate Change and Land, Summary for Policymakers
- UN Environment Programme: food loss and waste
Editor's note: This report does not present an unannounced target product, applicant count, footprint, budget, publication date, label or verification status as fact. Sun Lavieen's plan to calculate roughly 100 products with Okayama University was announced separately from the national model. Kikkoman's 122 g CO2e figure belongs to a previous soy-milk case and was not used to estimate any Sun Lavieen product. Recommendations about program design, disclosure and evaluation are Japan.co.jp analysis based on public materials, not announced government decisions. Research was current to 3:14 a.m. Japan Standard Time on August 15, 2026.