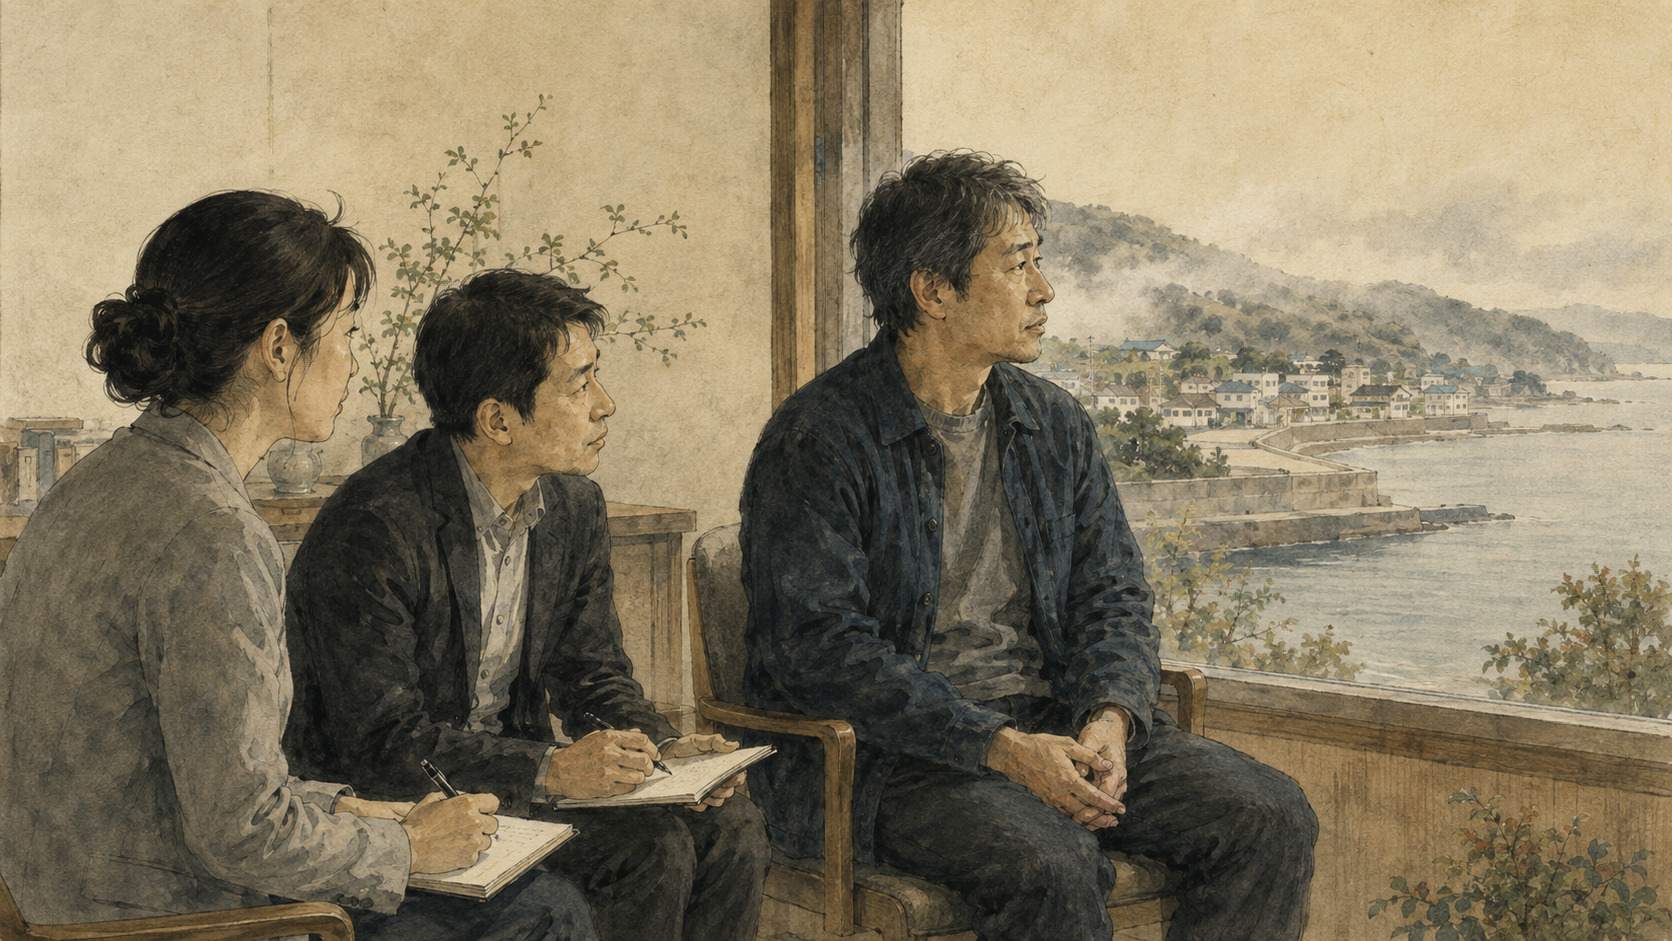
In November 2011, survey workers went door to door in Shichigahama, Miyagi Prefecture, carrying questionnaires. Eight months had passed since the tsunami. People who had lost homes were living in temporary housing or with relatives, and some had moved outside town. Roads and water systems were returning. Debris was disappearing. Sleepless nights, involuntary memories and the urge to avoid the shore were much harder to see.
The questionnaire did not end with a single visit. Tohoku University and the town’s Shichigahama Health Promotion Project continued following the community from 2011 through 2025. Fifteen years of answers have now produced a finding with practical force: the direction symptoms moved during the first year of follow-up was more informative about long-term posttraumatic stress reactions, or PTSRs, than one psychological snapshot soon after the disaster.
Of 1,291 people in the analysis, 190—14.7%—remained above the study’s threshold for clinically meaningful PTSRs at 15 years. Participants whose symptoms were already high and then worsened between the first two assessments had 5.31 times the adjusted odds of persistent symptoms compared with those whose early symptoms were not persistent. That number is not a declaration that a life becomes fixed in the first year. It is a warning to systems that would screen once and disappear.
The question was not only “How bad is it?”
The study was published in JAMA Network Open on August 14, 2026. It included adults in Shichigahama whose housing had been officially certified as suffering major partial destruction or worse in the Great East Japan Earthquake. Of 2,560 initial respondents, 1,291 who completed at least five of 11 survey waves were included in the trajectory analysis. Their mean age was 53.9, and 53.1% were women.
The IES-R scores intrusion—memories or images that enter uninvited—avoidance of reminders, and hyperarousal such as sleeplessness and heightened vigilance. The range is zero to 88. The study’s conceptual move was not to make the first score the center of prognosis. It connected the 2011 and 2012 observations and asked whether the line went up or down.
| Early pattern | Participants | Above the threshold at 15 years | Adjusted odds ratio |
|---|---|---|---|
| Nonpersistent early Below 25 at either of the first two waves | 1,006 (77.9%) | 89 (8.8%) | 1.00, reference |
| High-improving At least 25 at both waves, but stable or lower at wave two | 110 (8.5%) | 29 (26.4%) | 2.59 (95% CI, 1.53–4.40) |
| High-escalating At least 25 at both waves and higher at wave two | 175 (13.6%) | 72 (41.1%) | 5.31 (95% CI, 3.85–7.32) |
An odds ratio of 5.31 does not mean the probability was 5.31 times greater. The observed proportions were 41.1% in the high-escalating group and 8.8% in the nonpersistent group. Many people in the high-escalating group were below the threshold at 15 years, and some people in the reference group were above it. Population statistics do not pronounce an individual future. They can identify groups for whom follow-up should be harder to lose.
Seven shore communities, with the sea on three sides
Shichigahama is a 13.18-square-kilometer peninsula about 20 kilometers east of central Sendai, projecting into the southwestern edge of Matsushima Bay. Its name joined seven coastal settlements—Minatohama, Matsugahama, Shobutahama, Hanabuchihama, Yoshidahama, Toguhama and Higashimiyahama—when the village was established in 1889. Sea life reaches back through the Daigigakoi shell mound of the Jomon period and forward to fishing, farming and beach culture.
At 2:46 p.m. on March 11, 2011, a magnitude 9.0 earthquake shook eastern Japan. Shichigahama recorded an average intensity of upper 5 on Japan’s seven-point scale. The town’s official disaster plan records 113 people dead or missing and a peak of 6,143 evacuees. The tsunami completely destroyed 674 households, caused major partial destruction to 237 and half-destroyed another 413. Water, electricity and fixed telephone service failed across the town.
The study’s housing criterion matters. This was not an abstract sample of people who happened to live in a disaster region; it followed a community that had experienced severe residential loss. In the analytic cohort, 56.5% reported a near-death experience and 51.2% had a close person die or go missing. Among those with relocation data, 40.5% had moved at least three times. After the water receded, addresses, neighbors, medical care, employment and family roles continued to shift.
A disaster does not end when the shaking stops. It can continue on the day a family enters temporary housing, loses work, rebuilds a home—or tries to return to the sea.
It began by worrying about the people who did not come
The Shichigahama project began in field practice before it became a 15-year dataset. Tohoku University psychiatrist Hiroaki Tomita joined a Sendai mental-health relief team after the earthquake and began working in Shichigahama on March 22. With town physicians and public-health nurses, the team visited shelters and homes, helped psychiatric patients replace medicine and restart treatment, and responded to acute stress reactions.
As temporary housing opened in mid-June, “tea parties” began in community rooms so residents could speak with one another. Helpers soon worried about the people they could not see: those who never attended, those living with relatives and those who had moved beyond town. Waiting in a visible consultation room could miss the people most isolated. That concern became a door-to-door health survey.
The first wave in November 2011 drew responses from about 70% of people who had lost homes. Survey workers also visited former residents living outside Shichigahama. The team did not simply extract data. It visited people whose answers suggested high risk of depression or PTSRs, linked them to social support or treatment, and returned community findings through the town newsletter and tea parties. Research and care were designed as one loop.
March 11, 2011 Earthquake and tsunami; 113 people die or remain missing in Shichigahama.
March 22 Tomita and colleagues begin mental-health support in the town.
From June Tea parties open in temporary-housing community rooms; concern grows about nonparticipants and people outside town.
November The first door-to-door Shichigahama Health Promotion Project survey.
2012 The second assessment; the rise or fall between the first two waves later emerges as an important long-term signal.
2013–20 Annual follow-up and community support continue.
2021–24 No repeated assessments, limiting direct analysis of COVID-19 and other intervening stresses.
2025 The 15-year assessment.
August 14, 2026 Publication in JAMA Network Open.
Five paths—not “strong people” and “weak people”
Using 11 waves, the researchers identified five statistical trajectories. A resistant group with persistently low symptoms accounted for 38.8%. A subthreshold group accounted for 18.4%; a moderately sustained group, with high initial symptoms and partial decline, 21.1%; a recovery group, with elevated initial symptoms followed by marked remission, 17.7%; and a severely sustained group with chronic high distress, 4.0%.
| Fifteen-year trajectory | Share | How to read it |
|---|---|---|
| Resistant | 38.8% | Persistently low scores do not mean the disaster had no effect |
| Subthreshold | 18.4% | Symptoms below a research cutoff can still bring suffering and a need for support |
| Moderately sustained | 21.1% | High early symptoms partly decline but remain over the long term |
| Recovery | 17.7% | Marked remission after elevated early symptoms shows why one high score cannot fix the future |
| Severely sustained | 4.0% | Chronic high distress points to a need for durable specialist care |
“Resistant” is a statistical label, not a measure of character. The recovery group did not try harder, and the sustained groups were not weaker. Tsunami proximity, bereavement, housing uncertainty, repeated moves, sleep, isolation, age, health and available support intersected. The model found similar curves, not types of human being.
The model incorporating early change achieved an area under the receiver operating characteristic curve of 0.756, compared with 0.608 for the first score alone. A second-wave score by itself reached 0.726, so direction added information without becoming a crystal ball. An AUC of 0.756 is clearly better than chance but far from error-free individual classification. It can inform an offer of care. It should not become a gate that denies insurance, employment, housing or assistance.
Why can the second year be dangerous?
The study cannot establish the mechanism. Still, the finding that escalation was most common from the first to the second year fits the uneven clocks of reconstruction. The acute phase is dominated by rescue, food, medicine, funerals and immediate shelter. Months later, outside attention thins, temporary housing becomes prolonged, and differences in work and rebuilding prospects become visible. As a community is told to “move forward,” some people can feel increasingly left behind.
Early sleep disturbance was independently associated with 15-year persistence, with an adjusted odds ratio of 3.24. Being 70 or older carried an adjusted odds ratio of 3.45 relative to ages 20 to 49. Social isolation was associated at 1.46. These are not causal findings. They are useful partly because sleeplessness can be treated and isolation can be addressed through home visits, gathering places, transportation and practical support. Prediction has most value when it reveals something that can be changed now.
- Return: screen not only in the acute phase but around six months, one year, two years and later transitions.
- Watch direction: record worsening, improvement, recurrence and disappearance from follow-up—not the score alone.
- Join mind and life: ask about sleep, housing, bereavement, chronic illness, work, caregiving, relocation and isolation.
- Reach nonparticipants: combine clinics with home visits, telephone, secure digital options and primary care.
- Complete the handoff: with consent, connect findings to public-health nurses, clinicians, welfare, housing and employment support.
- Plan the ending: transfer long-term follow-up into ordinary community care before special disaster programs close.
From Kobe to Tohoku: when “care for the mind” became infrastructure
Japan’s disaster mental-health system changed after the 1995 Great Hanshin-Awaji Earthquake. Recognition of prolonged need led to a traumatic-stress care center five months later. That experience informed a long-term care center after the 2004 Niigata Chuetsu Earthquake and dedicated centers in Miyagi, Iwate and Fukushima after 2011. The Miyagi Kokoro no Care Center opened in December 2011.
But placing “kokoro no care”—care for the heart or mind—on a sign does not guarantee that people will enter. Stigma around psychiatry, fear of neighbors knowing, reluctance to ask when others seem worse, and the pressure of paperwork and work can all suppress help-seeking. Shichigahama’s practical lesson was to embed access in health checks, home visits, tea gatherings, town communications and daily support rather than summoning “the mind” into a separate room.
The World Health Organization similarly describes layered emergency support: community self-help and accurate information, psychological first aid, ordinary health and social care, and specialist treatment. Many stress reactions are understandable human responses and should not be medicalized. Distress that remains severe or impairs life, however, requires a dependable route to trained care.
The limits—and the ethics—of a 15-year study
Long follow-up accumulates missing data. The analytic cohort was 50.4% of the initial respondents, and the complete-case sensitivity sample contained 612 people. Socially isolated participants were underrepresented among those retained. Multiple imputation and inverse-probability weighting produced similar estimates, but those methods cannot fully recover the people hardest to reach.
The outcome was self-reported PTSRs, not PTSD established through clinical interview. Psychiatric treatments across the 15 years were not systematically collected. Relocation histories relied on recall. There were no repeated assessments from 2021 through 2024, preventing direct separation of COVID-19, aging, illness, bereavement and later disasters. A single town of severely housing-affected adults cannot automatically represent children, people displaced by the Fukushima nuclear accident, or survivors of war and disasters in other countries.
There is also an ethical boundary. If early worsening marks long-term risk, screening creates an obligation to offer care. Telling someone that they are high risk without a referral, treating a housing or income crisis only as a psychological problem, or allowing research data to create disadvantage would make observation another burden. A system that asks repeatedly must be prepared to answer repeatedly.
Fifteen years did more than move the disaster into the past. In Shichigahama, shores and roads were rebuilt, addresses changed, children became adults and helpers aged. By continuing to deliver the questionnaire, the project revealed that invisible reconstruction proceeds at several speeds.
A person with a low first score may struggle later. A person with a high first score may recover. The crucial response is not to blame worsening as a failure to “move on,” but to treat it as a signal for more support. Disaster mental-health care is not the technology of measuring a wound once. It is a long relationship through which a society refuses to lose sight of a changing person.
Study at a glance
| Paper | Posttraumatic Stress Dynamics and 15-Year Persistence in Great East Japan Earthquake Survivors |
|---|---|
| Publication | JAMA Network Open, August 14, 2026; doi:10.1001/jamanetworkopen.2026.29441 |
| Design | Prospective longitudinal cohort, 2011–2025; Shichigahama Health Promotion Project |
| Participants | Adults in Shichigahama with officially certified major partial housing destruction or worse; 1,291 in the analysis |
| Measure | IES-R, range 0–88; 25 or higher defined as clinically meaningful PTSRs |
| Main result | 14.7% at the threshold after 15 years; adjusted odds ratio 5.31 for high-escalating versus nonpersistent early symptoms |
| Other associations | Early sleep disturbance, social isolation, older age and repeated relocation |
| Main limitations | Observational design, 50.4% analytic retention, self-report, treatment not recorded, no repeated 2021–24 measures and one municipality |
- Li X et al., “Posttraumatic Stress Dynamics and 15-Year Persistence in Great East Japan Earthquake Survivors,” JAMA Network Open
- Tohoku University, “Tracking Trauma Over Time Improves Prediction of Long-Term Mental Health”
- Tohoku Medical Megabank Organization research release
- Tohoku Medical Megabank, “Post 3/11: Interview with Dr. Tomita”
- Tohoku University IRIDeS, Hiroaki Tomita research profile
- Tohoku Medical Megabank, Great East Japan Earthquake research record
- Town of Shichigahama, Disaster Management Plan, general section (PDF)
- Town of Shichigahama profile
- Town of Shichigahama history and culture
- WHO, “Historical developments in Health EDRM policy and research” (PDF)
- Miyagi Prefecture, mental-health care response archive
- WHO, “Mental health in emergencies”
Editor’s note: Percentages follow the paper’s reported or multiply imputed primary analyses. Odds ratios are not presented as risk ratios. The article distinguishes PTSRs from PTSD and describes an association, not causation. The trajectories are statistical groupings, not classifications of character. The currency display was supplied by the editorial desk.