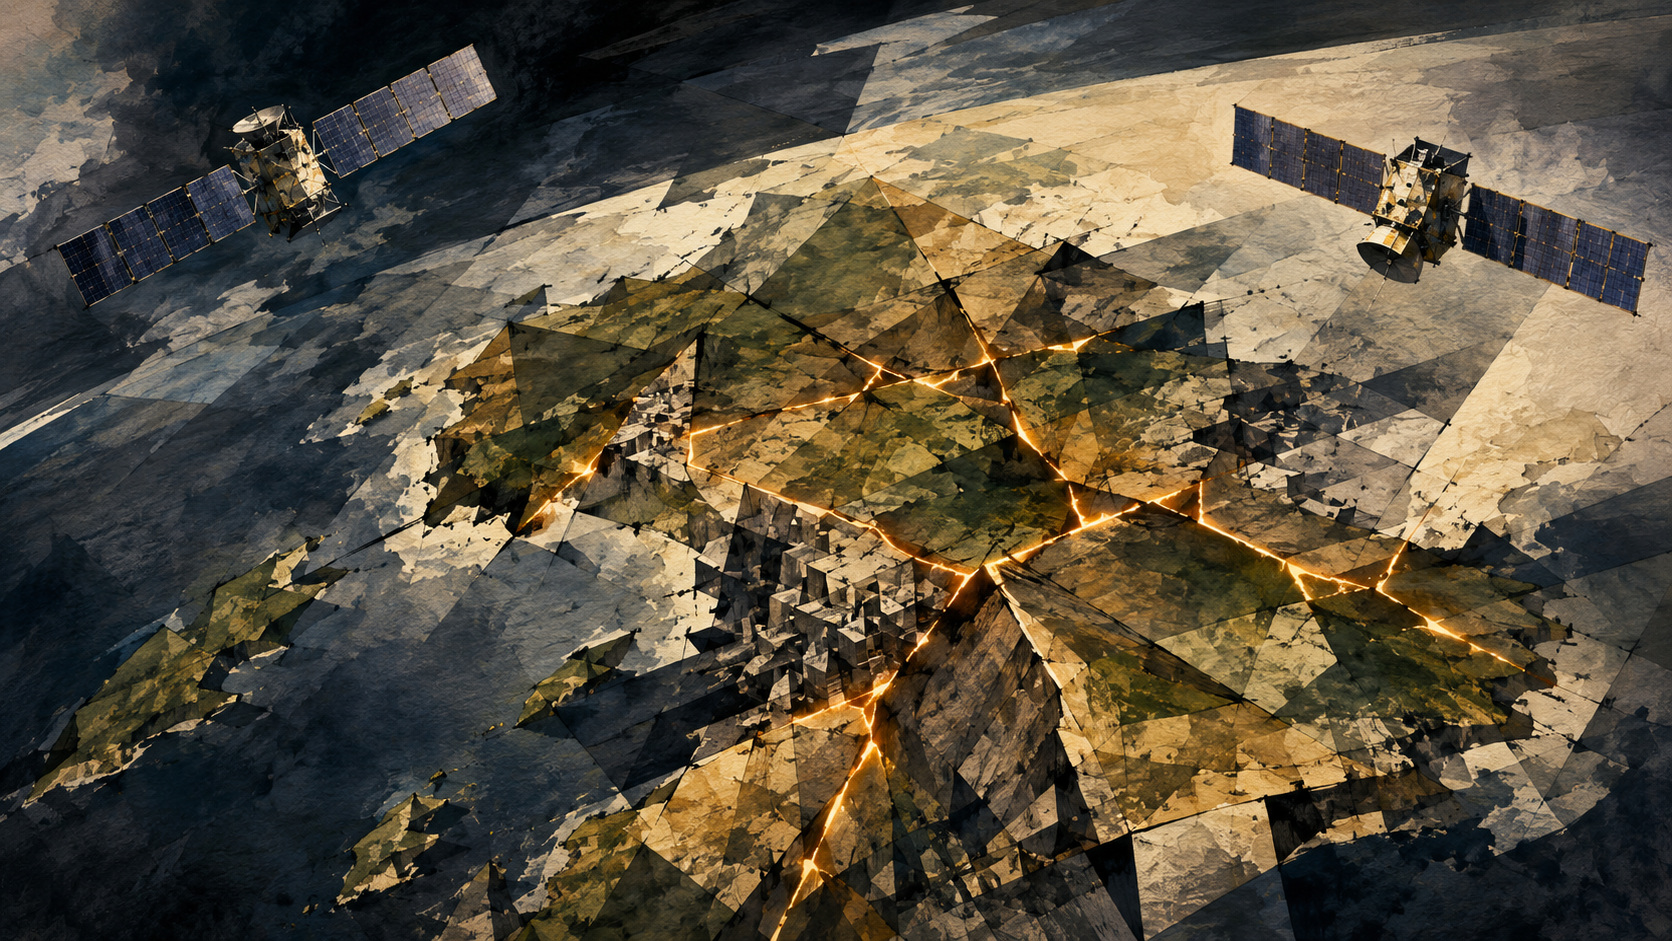
A map ordinarily assumes that the ground beneath it will remain where it was. At 4:27 PM on July 28, that assumption failed across part of Kumamoto. The magnitude 7.1 earthquake struck at a provisional depth of 16 kilometers. Uki City and Hikawa Town recorded the highest level on Japan’s seismic-intensity scale, 7. Homes shifted, roads cracked and water systems broke. Less visibly, the geographic framework beneath recovery—the measured positions from which roads, property boundaries and public works are surveyed—moved with the land.
Within hours, instruments on the ground and in orbit began constructing two different but complementary accounts. Japan’s nationwide GEONET network of continuously operating GNSS stations measured precise movement at fixed points. The Sencho station in Yatsushiro moved about 87 centimeters toward the northeast and subsided about 33 centimeters, according to GSI’s refined analysis. Radar satellites supplied the missing texture between those points: a continuous field of displacement extending across communities, farmland, hills and the fault zone itself.
The first radar products looked like bands of color. They recorded whether the surface had moved closer to or farther from a satellite—not whether it had moved north, east or down. By August 12, GSI had combined observations from multiple flight paths and look directions. The result separated motion into three components. Northwest of the Hinagu Fault Zone, the land had moved eastward by as much as about 80 centimeters, northward by as much as about 1.5 meters and downward by as much as about 60 centimeters.
What “Three-Dimensional” Means—and What It Does Not
The phrase can be misunderstood. GSI did not publish a three-dimensional photograph of the fault underground. The analysis describes the three components of movement at the surface: east–west, north–south and vertical. It answers a deceptively simple question—where did each measurable patch of land go?—by combining several observations that each answer only part of it.
A synthetic aperture radar satellite sends microwave pulses toward the ground and records the returning signal. When radar observations acquired before and after an earthquake are aligned, tiny changes in the phase of the signal can reveal a change in distance between the satellite and the surface. This technique, interferometric synthetic aperture radar, or InSAR, works at night and through cloud. The L-band radar used by the ALOS series has a relatively long wavelength, helping it preserve useful coherence across Japan’s vegetation compared with shorter-wavelength systems.
But one interferogram sees only along its line of sight. If a point moves farther from the satellite, that could mean that it traveled sideways, that it subsided, or some combination of both. It is like watching a person through one narrow camera angle: distance changes are visible, but the full direction of travel remains ambiguous.
ALOS satellites can fly northward or southward and illuminate the terrain to different sides of the orbit. GSI used measurements from several such geometries and solved for the east–west, north–south and vertical components using a least-squares approach. The August 12 table lists five input geometries with post-earthquake observations from July 28 through August 1, paired with earlier acquisitions dating from December 2024 to July 2026. Different incidence angles and viewing directions turned multiple one-dimensional measurements into one three-component displacement field.
| Observation | What it contributes | Important limitation |
|---|---|---|
| Single InSAR pair | Dense measurement of change along the satellite-to-ground line of sight. | Cannot by itself distinguish horizontal from vertical movement. |
| Multiple radar geometries | Different look directions make east–west, north–south and vertical estimates possible. | Accuracy varies with geometry, coherence and atmospheric conditions. |
| GNSS / GEONET | Highly precise three-component movement at permanent stations. | Provides points rather than a continuous surface map. |
| Field and aerial surveys | Confirm cracks, offsets, landslides and damage at human scale. | Take time and cannot immediately cover every affected location. |
These methods are strongest together. GNSS anchors the broad displacement with precise point measurements. SAR fills the space between stations. Aerial photographs, elevation models and field investigation connect those measurements to actual ruptures, damaged structures and terrain. No single instrument tells the entire story.
Why the Largest Number Is Northward
The 1.5-meter northward maximum is scientifically important partly because ordinary InSAR geometry is much more sensitive to east–west and vertical movement than to north–south motion. A near-polar satellite travels largely north and south. Movement parallel to that flight direction leaves a weaker signature in the conventional side-looking radar measurement. The full three-component solution therefore depends on varied observation geometries and analysis methods rather than a single colorful interferogram.
The pattern is consistent with a strike-slip earthquake. The Japan Meteorological Agency described the event as a crustal earthquake with a strike-slip focal mechanism and a north-northwest to south-southeast tension axis. The Earthquake Research Committee assessed that the magnitude 7.1 source fault extended through the northeastern part of the Hinagu section and into part of the Takano–Shirahata section of the Hinagu Fault Zone. Those are interpretations of the source based on multiple observations; the satellite displacement map is one essential body of evidence, not a direct photograph of a fault plane.
The Hinagu system is not a single line drawn cleanly across Kyushu. It likely extends roughly 81 kilometers from near Mashiki through Ashikita and toward the southern Yatsushiro Sea. Official long-term evaluation divides it into the approximately 16-kilometer Takano–Shirahata section, the roughly 40-kilometer Hinagu section and the possibly 30-kilometer Yatsushiro Sea section. The system is predominantly right-lateral strike-slip, with vertical components and places where multiple traces run alongside one another.
That geometry helps explain why the surface did not move as one rigid block. A major strike-slip rupture transfers one side of a fault laterally past the other, but bends, branches, changes in depth and distributed deformation complicate the surface expression. In 2026, the northwest side’s strong northward and eastward motion, together with subsidence, records that complexity in three components.
The Blank Areas Along the Fault May Be Where the Story Is Most Complicated
GSI placed an important warning beneath its maps: blank areas near the fault and elsewhere are places where displacement could not be measured because of complex movement and related effects. They must not be read as islands of stability.
Radar interferometry relies on recognizing a coherent phase relationship between two observations. Near a large surface rupture, the land can move too far between neighboring pixels, fracture into many small blocks, change its reflective properties, become covered by debris or water, or acquire such steep phase gradients that the mathematical “unwrapping” needed to recover absolute displacement becomes unreliable. Vegetation changes and atmospheric water vapor can add further noise. GSI used Japan Meteorological Agency numerical weather-model data to correct tropospheric delay, but no correction can restore information that the ground’s disruption has made incoherent.
The result is a paradox of earthquake mapping: the instrument can measure broad deformation with extraordinary detail while losing coherence in the narrow zone of most violent and complicated change. Researchers respond with other techniques—pixel offsets, multiple-aperture methods, comparison of digital surface models, aerial imagery and field mapping. GSI has separately released preliminary displacement-boundary and surface-height analyses for the 2026 event. The blank space is therefore not the end of observation. It is an instruction to change instruments.
- Do not add them into one simple total. The eastward, northward and downward maxima may occur at different pixels.
- Do not treat a blank pixel as zero. Close to the rupture, complex movement can make reliable InSAR measurement impossible.
- Do not confuse displacement with shaking. SAR measures where the surface ended up, not the peak acceleration a building experienced.
- Do not confuse surface motion with the underground fault model. Scientists infer the source at depth by combining deformation, seismic waves, aftershocks and geology.
2016: When ALOS-2 Revealed Motion Conventional InSAR Had Missed
Kumamoto has already changed the science of satellite earthquake observation once. On April 16, 2016, a magnitude 7.3 mainshock ruptured the Futagawa Fault Zone after a magnitude 6.5 event two days earlier. The faulting ran from the junction with the Hinagu Fault Zone toward Aso. Surface ruptures cut roads and fields, but the pattern did not end at the most obvious scar.
ALOS-2 had been in orbit for less than two years. GSI applied Multiple Aperture Interferometry, or MAI, to measure along-track displacement that standard InSAR geometry had difficulty seeing. The analysis found approximately one meter of northward movement north of the Futagawa Fault Zone and southward movement on its southern side, consistent with right-lateral slip. It also traced abrupt changes from the Hinagu junction eastward beyond the western rim of the Aso caldera and indicated motion in the northern Hinagu Fault Zone.
Subsequent research combined InSAR, MAI, split-band interferometry and pixel-offset methods to recover three-dimensional deformation and quantify its uncertainty. The 2016 data showed not only the main rupture but a web of smaller faults, some actively producing earthquakes and others apparently moving passively in response. That challenged a simple picture in which one mapped active fault alone accounts for every line of deformation.
The historical connection to 2026 is therefore more than geography. Methods refined on the 2016 earthquake helped establish how to recover north–south motion and how to interpret a distributed deformation field. In 2025, GSI released the 2016 three-component results as open GeoTIFF data. In 2026, a new Kumamoto earthquake arrived while ALOS-2 was still operating and ALOS-4 had joined it, allowing the older scientific experience and the newer observing capacity to work together.
January 2006 Japan launches the first ALOS, combining optical and L-band radar Earth observation.
May 2014 ALOS-2 enters orbit with the PALSAR-2 L-band synthetic aperture radar.
April 2016 ALOS-2 maps complex deformation from the Kumamoto earthquake sequence.
July 2024 H3 Flight No. 3 launches ALOS-4, carrying the wider-swath PALSAR-3 radar.
July 28, 2026 The magnitude 7.1 Kumamoto earthquake strikes at 4:27 PM JST.
July 28–August 1 Post-earthquake ALOS observations supply several viewing geometries.
August 12, 2026 GSI publishes its preliminary three-component analysis.
From ALOS-2 to ALOS-4: More Ground, More Often
ALOS-2, launched in May 2014, carries the PALSAR-2 L-band radar and has far exceeded a nominal mission measured in years. Its longevity matters because interferometry depends on comparison: a post-disaster observation gains meaning from an earlier image acquired with compatible geometry. Some of the pairs used for the 2026 Kumamoto analysis reach back many months, and one preliminary ALOS-2 product paired a July 29 observation with an acquisition from 2022. Long archives turn a satellite into a record of where the ground used to be.
ALOS-4 was launched by H3 Flight No. 3 on July 1, 2024 and flies in the same 628-kilometer sun-synchronous orbit as ALOS-2. Its PALSAR-3 instrument preserves high spatial resolution while greatly widening coverage. JAXA lists a 100-to-200-kilometer swath for stripmap observations, compared with 50 to 70 kilometers for ALOS-2, and up to 700 kilometers in ScanSAR mode. For three-meter observations over Japan, JAXA describes a planned increase from about four opportunities a year to roughly twenty—about once every two weeks.
The advantage is not that one newer satellite makes the older one irrelevant. The combination provides additional viewing opportunities, a deeper archive and varied geometry. ALOS-2 contributes continuity through the 2016 and 2026 Kumamoto events; ALOS-4 contributes frequency and width. The August 12 result demonstrates the value of overlap: two generations of Japanese radar satellites observing the same fault system during the same emergency.
When the Coordinates Used for Reconstruction Are No Longer Correct
Crustal deformation may sound like an abstract geophysical measurement, but it produces an immediate administrative problem. Surveying is built from control points with official latitude, longitude and elevation. If those points moved tens of centimeters—or more than a meter—then pre-earthquake coordinates no longer describe their physical locations accurately.
GSI suspended publication of results for affected basic control points and changed the status of public control points across 28 Kumamoto municipalities. The agency warned that surveys based unknowingly on pre-earthquake results might be inaccurate. New coordinates and correction procedures are not clerical housekeeping. They are part of rebuilding roads, utilities, drainage, property boundaries and public facilities on a landscape with a new geometry.
The displacement field also improves the fault models used to understand where slip occurred at depth. Those models can help scientists interpret aftershock zones, identify places that require field inspection and test whether observed damage corresponds to the mapped rupture. The information does not predict the next earthquake, and a deformation maximum is not automatically the location of maximum damage. It does, however, replace a vague statement—“the region moved”—with a spatially organized measurement of how.
Recovery planners must also follow what happens after the principal rupture. GSI’s GNSS network detected postseismic deformation after July 28. Fault afterslip and deeper crustal adjustment can continue after the shaking that people remember has stopped. Those motions are usually much smaller than the coseismic jump, but over months or years they can matter to high-precision surveying and to the scientific reconstruction of the event.
A Fault System With a Longer Memory Than Any Satellite
The satellites are new; the fault is not. The Hinagu Fault Zone reaches from its northern junction with the Futagawa system toward the Yatsushiro Sea. Geological evidence summarized by the Earthquake Research Committee places the latest activity of the Hinagu section sometime between about 8,400 and 2,000 years ago before the 2026 event. The Yatsushiro Sea section may be associated with the Higo earthquake of AD 744, although that historical connection remains a possibility rather than a certainty.
Before July 2026, long-term evaluations described the fault in segments because different portions can have different histories, lengths and recurrence behavior. The 2016 earthquake was assessed as an event of the Futagawa section, although deformation and earthquake activity also involved the northern Hinagu area. The 2026 event shifted the center of rupture southwest along the connected system, principally involving the Takano–Shirahata and Hinagu sections according to the committee’s assessment.
This does not mean that one earthquake simply marched toward the next according to a schedule. Fault interactions are more complicated, and long-term probability is not a short-term clock. What the paired history does show is that the Futagawa–Hinagu system must be understood as a connected, segmented structure capable of distributing strain, rupture and secondary movement across a broad part of central Kyushu.
The Map Is Preliminary Because Science Is Supposed to Change
GSI labels the three-dimensional analysis preliminary. That word should inspire confidence rather than suspicion. Satellite orbits are refined after observation. More complete GNSS data reduce scatter. Atmospheric corrections can be improved. Additional radar passes create new combinations, and field evidence can reveal where a smooth mathematical solution crosses a complex rupture.
The agency’s first GNSS figures for Sencho described about 32 centimeters of subsidence; its refined August 12 analysis reported about 33 centimeters after using improved satellite-orbit information and full-day observations. This is not a contradiction. It is a measurement becoming better constrained. The same discipline applies to the SAR result: the reported maxima and maps are the best public analysis at the stated time, not immutable final numbers.
There is also an ethical reason for precision. A spectacular map can create the impression that a disaster has been completely seen from space. It has not. Radar does not show the exhaustion of a family in a shelter, the loss carried by a shopkeeper, or the difficulty of restoring water street by street. It measures something narrower and indispensable: the rearrangement of the land on which every one of those human consequences unfolds.
ALOS-2 and ALOS-4 turned invisible movement into a measurable surface. The result connects orbital engineering, geodesy and the daily work of recovery. In the places where the colors are clear, it tells Kumamoto how far and in which direction the ground traveled. In the blank zones, it admits that the rupture was too complex for one method. And in the months ahead, repeated observations will show whether the landscape has finished adjusting—or is still, slowly, moving.
Reporting Notes and Principal Sources
This article uses public information available through August 13, 2026 at 9:52 AM JST. GSI describes its three-dimensional result as preliminary. Component maxima may occur at different locations and are not presented here as one combined displacement vector. The article distinguishes measured surface displacement, inferred fault geometry, shaking intensity and physical damage.
- Geospatial Information Authority of Japan: ALOS-2 and ALOS-4 crustal deformation analysis for the 2026 Kumamoto earthquake
- GSI: English overview and observation geometries used in the analysis
- GSI: Refined GEONET crustal-deformation results and postseismic movement
- Japan Meteorological Agency: July 2026 earthquake activity in Kyushu
- Earthquake Research Committee: Updated evaluation of the 2026 Kumamoto earthquake, August 12
- Headquarters for Earthquake Research Promotion: Futagawa and Hinagu fault zones
- GSI: How multiple SAR geometries produce three-component displacement
- GSI: ALOS-2 analysis of deformation around the 2016 Kumamoto faults
- GSI Open Data: Three-dimensional ALOS-2 deformation from the 2016 Kumamoto earthquake
- JAXA: ALOS-4 mission, observation width and frequency
- JAXA: ALOS-2 mission and launch history
- GSI: Treatment of public survey control points after the 2026 earthquake