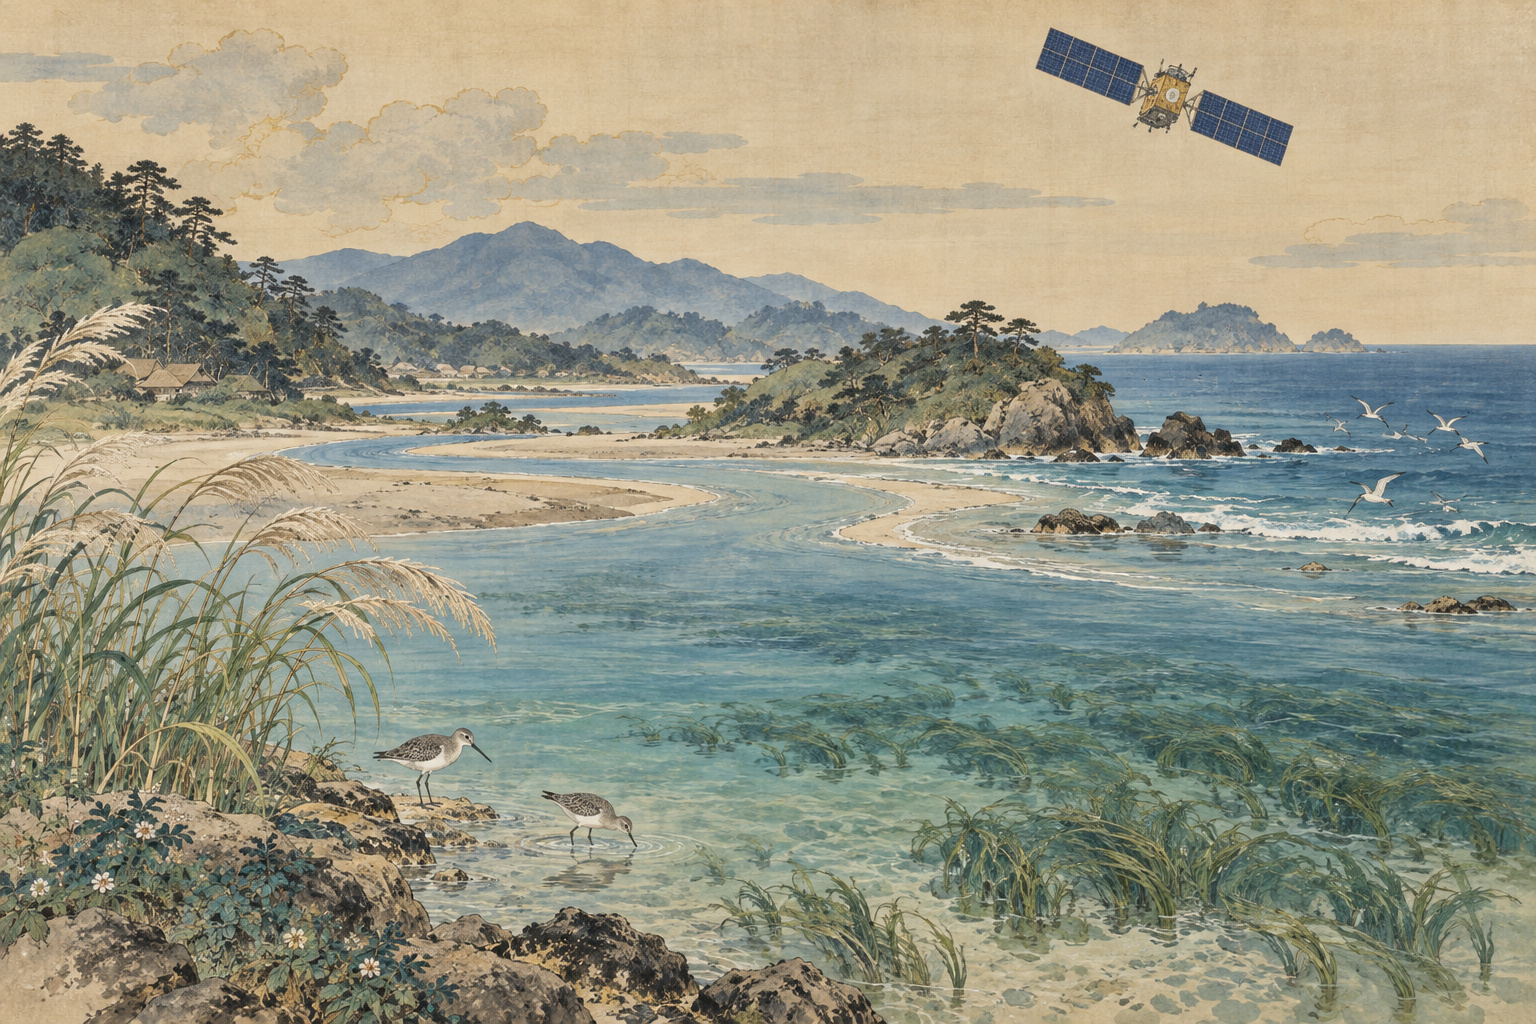
A map of a seagrass meadow shows where a habitat is. It does not show the full journey of the organic material produced there—or the material arriving from a river. A study using Japan’s Shikisai satellite asks whether a broad view of suspended particles can help fill that gap. Its results connect coastal-water patterns with river mouths and recorded seagrass locations in Sagami and Suruga bays.[1]
The finding is a possible route to better observation, rather than a satellite measurement of carbon sequestration. Total suspended matter, or TSM, includes mineral sediment as well as organic particles. The study’s detailed announcement explicitly says that the relationship with actual particulate organic matter concentrations was not directly validated. That boundary is essential to understanding both the promise and the next research task.[2]
What Shikisai sees
Shikisai, formally GCOM-C, carries the Second-generation Global Imager, SGLI. JAXA describes a mission observing the land, ocean and atmosphere to understand climate processes, including the carbon cycle and Earth’s radiation budget. Its optical measurements include ocean color; they do not collect a water sample or weigh the carbon stored beneath a meadow.[4][5]
The coastal study uses TSM estimated from satellite observations. Particulate organic matter, or POM, is one component of that suspended material and can include biological remains, fragments and plankton. POM is itself material containing carbon, rather than a measurement of carbon alone. Keeping those quantities separate prevents a water-quality indicator from being mistaken for a carbon inventory.[1][10]
There are several steps between an optical signal and a climate claim. First comes the estimate of suspended material. Next comes the composition and origin of that material. Finally comes its fate: whether carbon remains stored, is moved elsewhere or is returned to active cycling. Evidence for the first step does not eliminate the need to investigate the others.
Two bays, one year and a defined coastal strip
| Item | Setting | Meaning |
|---|---|---|
| Observation year | 2023 | Annual mean TSM; not a 2026 coastal-conditions bulletin. |
| Analysis unit | 250 m grid | A cell can include different local conditions. |
| Study extent | Within 1,500 m of shore | Coastal Sagami and Suruga bays; not a whole-bay carbon budget. |
| Comparison | TSM, river mouths and seagrass records | Spatial associations, not direct POM or sequestration measurements. |
Source: detailed joint research release.[2]
The researchers calculated annual mean TSM from 2023 observations and compared it with distance from river mouths and the distribution of recorded seagrass beds. They identified river mouths using national river data and Geospatial Information Authority of Japan aerial photographs. Habitat information came from the Environment Ministry’s National Survey on the Natural Environment.[2]
Both bays showed lower TSM with increasing distance from river mouths. Locations with seagrass records showed significantly higher values than surrounding coastal waters. The researchers interpret the patterns as potentially reflecting organic material supplied by rivers, produced around meadows or trapped by them. These are interpretations of spatial associations, not direct tracking of individual particles.[2]
The annual average is useful for examining broad spatial patterns. It cannot reveal the detailed sequence of a flood plume or show that every season has the same relationship. A year with unusual rainfall or coastal conditions could also differ from another year. Repeating the analysis across years would test how transferable the pattern is; the 2023 result should not be presented as a report of September 2026 conditions.
At 250 meters on each side, a square analysis cell represents 6.25 hectares. A small habitat and neighboring water can therefore share a cell. That scale makes regional comparison possible while limiting how confidently a signal can be assigned to a fine habitat boundary. The resolution is part of the interpretation, not merely a specification in the methods.
A promising pattern with several possible causes
A river can carry organic particles and mineral sediment together. Coastal TSM can also increase through phytoplankton or resuspension of bottom sediment, as the detailed release notes. A high value therefore has more than one possible explanation. The satellite-derived pattern does not, on its own, identify how much of it came from seagrass.[2]
Even a reliable estimate of organic material would leave another question: what happens to it? Some may settle, some may travel and some may decompose. A concentration at a location is different from the amount moving through that location over time, and both differ from the stock retained in sediment. A useful carbon assessment has to specify which of these quantities it is estimating.
This is why a ranking of sites by TSM would not be a ranking of their climate benefits. A place with abundant suspended sediment need not have the greatest organic-carbon storage. Conversely, a valuable store below the seabed need not generate a strong surface-particle signal. The potential contribution is to help locate and investigate processes, rather than to substitute one number for all of them.
The habitat map carries a history too
Some of the seagrass information came from historical surveys. The researchers treated previously recorded sites as places where the habitat was likely still present. That makes older records useful, but it does not amount to confirmation of living seagrass at every site in 2023.[2]
If a meadow has contracted, recovered or moved, a comparison with later satellite observations can become harder to interpret. Updating habitat records would therefore do more than improve a background map: it would improve the evidence used to interpret the satellite signal. The dates of ecological surveys deserve the same attention as the dates of satellite scenes.
Before blue carbon became a policy term
In 2005, Duarte, Middelburg and Caraco published an assessment of the role of marine vegetation in oceanic carbon burial. Their Biogeosciences paper examined vegetated coastal sediments and emphasized that burial accounts for only part of ecosystem production. It placed coastal habitats within a wider budget of production, export and respiration.[8]
That history matters because the current problem did not begin with the ability to make a satellite map. Researchers have long needed to connect the carbon a habitat produces with where that carbon ends up. The new study examines a possible observational clue along that route; it does not collapse the route into a single measurement.
Japan’s transport ministry traces the blue-carbon name to UNEP’s October 2009 report. The concept brought marine and coastal ecosystems into greater focus as carbon sinks. Japanese discussion also includes seaweed habitats alongside seagrass, mangroves and coastal wetlands. This study’s seagrass comparison should nevertheless retain its specific scope, rather than being generalized to every marine vegetation type.[6]
The policy context has continued to develop. Japan’s Environment Ministry records that the country reported combined uptake by seagrass and seaweed beds to the United Nations in April 2024. That national reporting milestone is separate from the present satellite study; it does not establish TSM as an approved calculation of removals or as a carbon credit.[7]
As carbon information becomes more consequential, definitions become more valuable. Habitat area, particle concentration, carbon stock and annual removal answer different questions. A method can improve one part of the evidence without being sufficient for every accounting purpose. The distinction protects the usefulness of the science as much as the credibility of the eventual claim.
A climate satellite finds a coastal application
Shikisai launched on December 23, 2017. JAXA describes SGLI observations at resolutions from 250 meters to one kilometer and global coverage approximately every two or three days. That coverage description is not a promise of an unobstructed observation at every coastal site on each cycle. A usable optical record also depends on observing conditions.[5]
The value of a long-running mission includes the possibility of asking new questions of an existing archive. Here, 2023 observations were examined for relationships relevant to coastal organic matter. A regional view can help connect rivers, habitats and adjacent waters that might otherwise be sampled as separate places.
The paper’s authors are Takeshi Osawa, Narumasa Tsutsumida and Hideyuki Doi. Kyoto University identifies Doi as a professor in its Graduate School of Informatics. Saitama University labels Tsutsumida’s affiliation there as belonging to the time of the research. The universities announced the work on September 11 and give August 15 as its publication date in Environmental Advances.[1][3][9][10]
What would make the next map more informative?
The researchers call for field measurements of POM concentration and composition to test their relationship with satellite-derived TSM. Sampling supplies information about what is in the water; satellite observations supply spatial coverage. Used together, they can turn a promising association into a better-grounded environmental indicator.[2]
Japan.co.jp’s assessment is that the immediate opportunity is to guide investigation. A regional map could help select contrasting sampling locations, including river-influenced waters and areas with updated seagrass records. Repeating matched observations across seasons and flow conditions would test whether the same explanation holds. These are potential uses, not completed validation reported by the study.
Assessing sequestration would require further evidence about transport and retention. Knowing where particles occur can help frame that work, but a surface distribution cannot reveal the duration of storage below the seabed. The strongest outcome would combine observation scales instead of asking one sensor to answer questions outside its reach.
Shikisai offers a wider view of the coast’s moving material. The study suggests where that view may be useful and identifies what must still be checked in the water. Its practical promise is a more informed connection between the river mouth, the meadow and the places where carbon ultimately remains.
Sources and references
- Kyoto University, Shikisai coastal blue-carbon research announcement, September 11, 2026.
- Detailed joint research release, methods, scope and limitations, Figures 2–3; hosted by Kyoto University.
- Osawa, Tsutsumida and Doi, Environmental Advances 25, 100747 (2026). Paper DOI.
- JAXA, Shikisai (GCOM-C), mission and SGLI overview.
- JAXA, Shikisai mission profile, launch date and observation specifications.
- MLIT Ports and Harbours Bureau, blue-carbon definition and history.
- Ministry of the Environment, blue-carbon information, including the 2024 UN reporting milestone.
- Duarte, Middelburg and Caraco, Major role of marine vegetation on the oceanic carbon cycle, Biogeosciences 2, 1–8 (2005).
- Kyoto University researcher database, Hideyuki Doi’s name and affiliation.
- Saitama University, joint announcement, September 11, 2026; distinguishes Tsutsumida’s affiliation at the time of the research.
Evidence cutoff: September 13, 2026. The study account follows the universities’ detailed research release. Prospective benefits are distinguished from measured results; interpretations are Japan.co.jp analysis unless otherwise attributed.