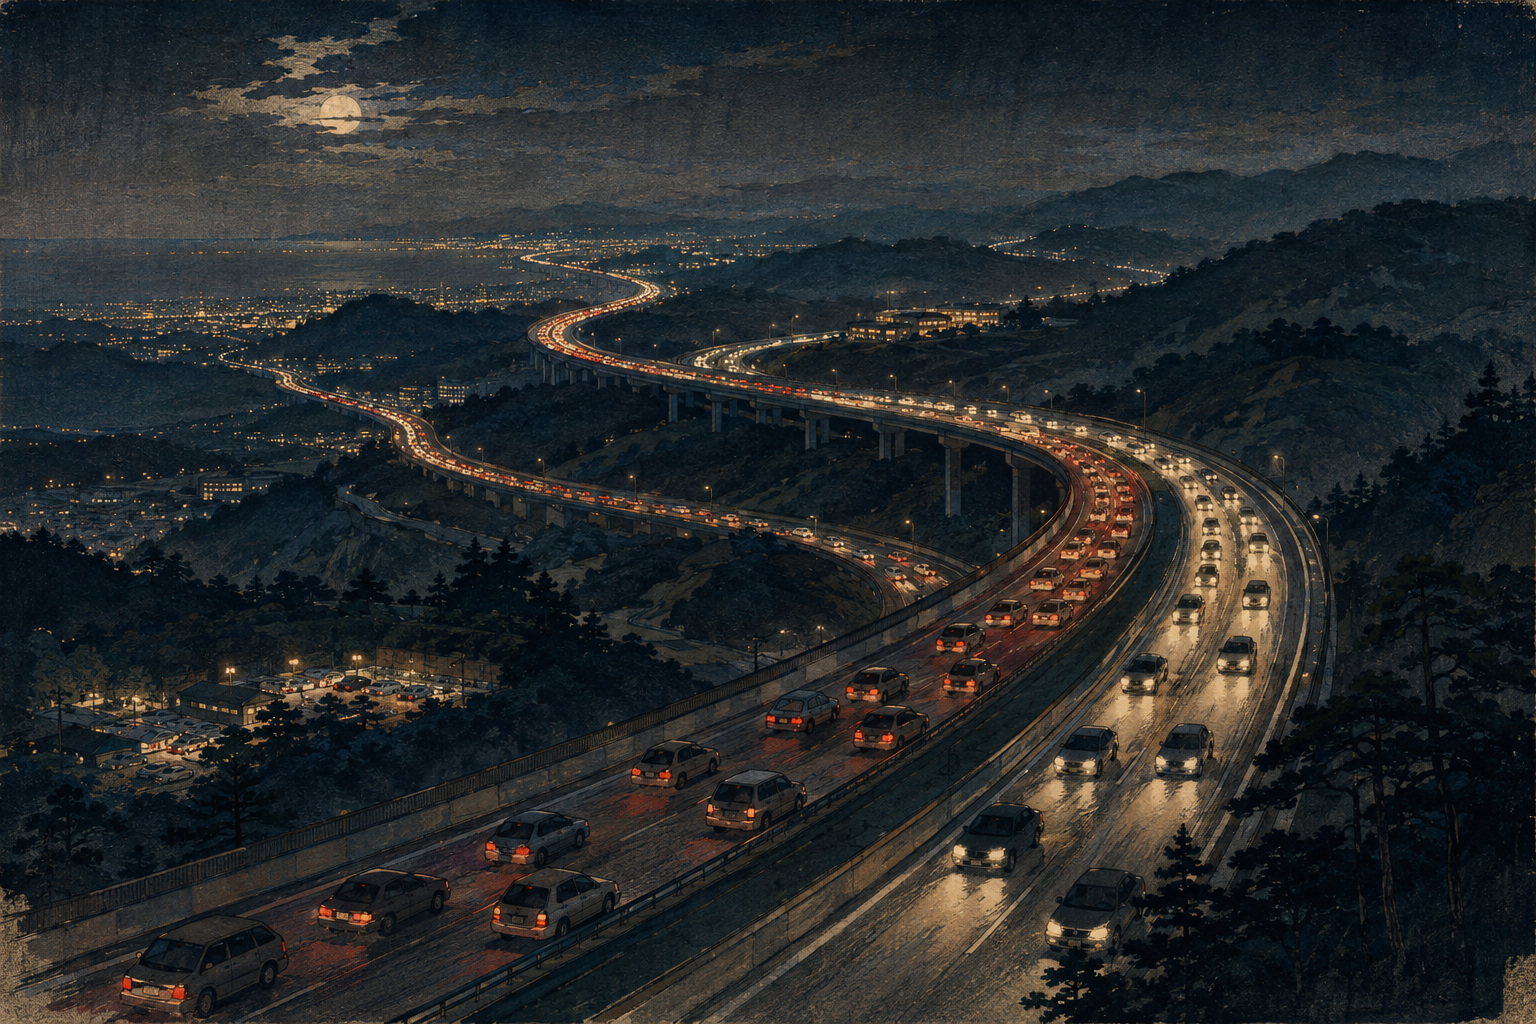
The most mysterious traffic jam ends without revealing its cause.
For an hour, a family has followed a river of brake lights on the Chūō Expressway. The navigation display is red from edge to edge. The driver imagines a collision, roadworks, perhaps a fallen load. Then the traffic loosens near Sagamiko. There is no wreck, no closed lane and no worker waving cars through. The road simply begins to climb so gently that the eye had not registered the change.
“Nothing happened” is the wrong conclusion. Hundreds of small things happened. One car lost a little speed at a sag—the concave transition from a descent to an ascent. The next driver noticed late and braked slightly harder. The reaction moved backward from vehicle to vehicle. Cars at the front escaped while new cars joined at the rear. The queue travelled toward Tokyo even as every vehicle pointed away from it.
Japan’s Obon expressway migration is often narrated as a problem of quantity: too many families, too few lanes. Quantity matters, but timing and instability explain the shape. A shared calendar injects vehicles into a network in synchronized bursts. Road geometry seeds small speed losses. Human following behavior amplifies them. Once a bottleneck breaks down, the road may discharge fewer cars than it handled immediately before the queue.
The official 2026 forecast makes that system unusually legible. It predicts two national outbound peaks, on Saturday, August 8 and Thursday, August 13; the return flow swells on Friday the 14th and Saturday the 15th. The forecast is less a prophecy than a map of collective intention. It anticipates when work schedules, Mountain Day, ancestral rites and family expectations will place pressure on the same slopes and tunnel mouths.
How to Read 436
The national release by the three NEXCO companies, JB Honshi Expressway and the Japan Road Traffic Information Center covers ten days from August 7 through 16. Its headline total is 436 queues caused by traffic concentration and forecast to reach at least 10 km. Six outbound and six inbound events are forecast to reach at least 30 km. Planned long-term construction restrictions are included; accident-caused congestion is not.
The distinction matters. Under the NEXCO definition, congestion means a line of vehicles travelling at 40 km/h or less—or repeatedly stopping and starting—that extends at least 1 km and persists for at least 15 minutes. A “45 km queue” is the measured spatial reach of that slow-moving condition at its maximum, not a 45 km row of permanently parked cars. The nationwide chart also omits every event that remains below its 10 km reporting threshold.
The forecast is built from past congestion and recent traffic conditions. Weather, collisions, breakdowns and changed behavior can make reality diverge. The comparison with 2025 is especially delicate: operators expect 436 events, 91 more than last year’s observed 345, but say poor weather discouraged travel in 2025. The 2025 actual count also includes accident effects, while the 2026 forecast does not. The numbers belong beside each other, not in a clean performance league table.
| 2026 forecast | Outbound | Inbound | Total |
|---|---|---|---|
| 10 km or more | 188 | 248 | 436 |
| 30 km or more (included above) | 6 | 6 | 12 |
| Largest daily crest | 27 on Aug. 8; 29 on Aug. 13, including 30 km+ events | 39 on Aug. 14; 45 on Aug. 15, including 30 km+ events | Return movement is more concentrated late in the period |
A Calendar Builds Two Outbound Tides
In 2026, August 8–9 is a weekend. Mountain Day falls on Tuesday, August 11. The conventional August Obon entrance is Thursday the 13th, followed by Friday and a weekend ending Sunday the 16th. That awkward arrangement creates options. Some households can begin a long break on the first weekend, especially by taking leave around Monday or Wednesday. Others depart close to the ancestral welcome on the 13th. The national chart records the result as two crests rather than one.
That calendar explanation is an inference from the official pattern, not a survey of every driver’s motive. Regional releases strengthen it. NEXCO Central expects its outbound peak on August 8–9. In NEXCO East’s capital-region area, where roads carry families away from Greater Tokyo, the outbound concentration is later, on August 12–13. Stitched together, different regional clocks become the national double wave.
Direction labels can mislead readers unfamiliar with Japanese highway language. “Outbound” and “inbound” are route-designated directions, conventionally described as away from or toward major metropolitan areas; they are not a claim that every traveller is leaving Tokyo or returning to it. Obon traffic includes visits between regional cities, leisure trips, freight and ordinary local journeys caught in the same flow.
| Date and direction | Forecast bottleneck | Maximum / window | Peak passage estimate |
|---|---|---|---|
| Aug. 8, outbound | E20 Chūō, near Sagamiko IC | 45 km; 4 a.m.–2 p.m. | Takaido–Sagamiko: about 135 min, versus 35 normally |
| Aug. 13, outbound | E20 Chūō, near Sagamiko IC | 45 km; 5 a.m.–2 p.m. | About 135 min, roughly 100 min above normal |
| Aug. 13, outbound | E4 Tōhoku, near Yaita-kita PA | 35 km; 8 a.m.–4 p.m. | Kanuma–Nishinasuno-Shiobara: about 85 min |
| Aug. 15, inbound | E17 Kan-Etsu, near Sakado-Nishi Smart IC | 40 km; 2 p.m.–midnight | Fujioka JCT–Tsurugashima: about 80 min, versus 25 normally |
| Aug. 15, inbound | E20 Chūō, near Kobotoke Tunnel | 30 km; 1 p.m.–midnight | Ōtsuki–Hachiōji JCT: about 120 min, versus 25 normally |
The Road Migration Japan Built
Obon predates the automobile by centuries. The expressway version belongs to postwar Japan. The first section of the Meishin Expressway opened in 1963; the route was completed in 1965. The Tōmei opened throughout in 1969. Around the capital, a 1963 plan imagined three ring roads and nine radial routes. The Chūō reached Hachiōji in 1967, the Tōhoku began pushing north in the 1970s, and the Kan-Etsu and Tōhoku were completed in the 1980s.
Those roads did more than shorten journeys. They gave the modern holiday a visible national form: urban households could load children, gifts and grave flowers into one car and return on a shared timetable. Radio bulletins, television helicopters and the language of the U-turn rush turned the red line of vehicles into a seasonal image. The network made dispersed hometown ties traversable—and made their synchronization measurable.
Technology removed one old villain. ETC began general service in 2001. As non-stop electronic payment spread, waiting time caused by toll-plaza congestion fell sharply; NEXCO East now says congestion at toll booths, once the worst traffic-concentration source, has almost disappeared. Yet the Obon queue survived. Removing the cash booth exposed a harder fact: the bottleneck may be a barely perceptible slope or a pattern of collective reaction that cannot be dismantled like a gate.
1963 The first Meishin section opens; Japan’s intercity expressway age begins.
1969 The Tōmei is fully open, binding Tokyo and Nagoya into the new road network.
1985–87 The Kan-Etsu and Tōhoku routes are completed, extending the capital’s radial system.
2001 General ETC service starts; toll-plaza stopping steadily ceases to dominate congestion.
2008 A Japanese experiment demonstrates a stop-and-go wave without any bottleneck.
2022 onward Holiday discounts are withheld during Golden Week, Obon and New Year to discourage peak concentration.
2026 Operators forecast two outbound Obon crests and 436 queues of 10 km or more.
The Sag: An Invisible Hill with a Large Shadow
A sag is not a dramatic mountain grade. It is the concave point where a downhill section changes to uphill. The driver’s view, engine note and speedometer may offer no urgent signal. Under light traffic, a loss of a few kilometers per hour is harmless. Near capacity, it changes the flow entering the bottleneck faster than the road can release it.
NEXCO East reports that about 70% of its 2024 congestion was caused by traffic concentration. Among those events, uphill and sag locations accounted for about 60% of bottlenecks. The 2026 avoidance guide names a sag as the mechanism at three emblematic sites: Sagamiko on the Chūō, Yaita-kita on the Tōhoku and Sakado-Nishi on the Kan-Etsu. Kobotoke combines a long ascent with a tunnel.
Imagine a two-lane section carrying a stream near its maximum stable flow. The lead vehicle eases from 90 to 86 km/h on the ascent. A following driver closes the gap and brakes to 82. The next reacts to the brake lamp rather than the slope and falls to 75. Each reaction arrives slightly late and may be slightly larger. Farther back, one driver must stop. The loss of speed has become a wave.
This is why the “head” of a queue can appear empty. Its cause is not an object occupying the road; it is a location where the traffic state repeatedly changes. At the front, cars accelerate away. At the rear, new cars encounter the slower state. The queue boundary moves backward even though no vehicle reverses.
Twenty-Two Cars and a Jam from Nothing
In 2008, a Japanese research team made the invisible visible. They placed 22 vehicles on a flat, single-lane circular track 230 meters around. Drivers were asked to follow safely while trying to maintain roughly 30 km/h. The vehicles began almost evenly spaced. There was no merge, toll gate, crash, hill or lane closure.
Small differences in following distance appeared and grew. About three minutes into the reported sequence, several cars were forced to stop. Cars at the front of the cluster accelerated away while cars arriving at the rear joined it. The stop-and-go cluster propagated backward at roughly 20 km/h. The experiment did not show that road bottlenecks are irrelevant. It showed why, once density is high enough, a bottleneck can be only the trigger; the stream itself can amplify a tiny fluctuation.
The result gives the Obon driver a better answer to “who caused this?” A particular unnecessary brake can seed a disturbance, but the 30th vehicle’s stop is a collective product. Blame is less useful than stability. A generous gap absorbs small changes. A short gap converts them into brake commands. Smooth recovery beyond the bottleneck releases the vehicles behind.
Why One Brake Can Become Thirty Kilometers
Traffic engineers describe road performance through flow, density and speed. Flow counts how many vehicles pass a point in a unit of time. Density measures how closely they occupy the road. At low density, adding cars increases flow. Near capacity, speeds become sensitive and the same addition can destabilize the stream. If more vehicles arrive at a bottleneck than leave it, the queue grows upstream.
Then comes capacity drop. Research on expressway sags models a phenomenon in which discharge after breakdown is lower than the maximum flow just before breakdown. In plain language, a road that has started queuing may process fewer vehicles than the same road did moments earlier. The jam can therefore persist after demand has retreated below the pre-queue maximum. “The rush should be over” does not mean the accumulated queue has dissolved.
This also explains why queue length and delay do not move in lockstep. A 25 km queue creeping steadily can impose less time than a shorter stop-and-go queue. Official route tables therefore give both length and passage time. On the August 8 Chūō forecast, the Takaido–Sagamiko trip rises from about 35 minutes to 135—a 100-minute penalty. The time is the practical burden; the length is the map’s dramatic red line.
Lane Changes: A Search for Advantage That Taxes Everyone
When one lane appears to move, changing lanes feels rational. But the view from a single windshield is a poor sample. A car entering a short gap makes the following driver brake. That brake propagates. The driver left behind may change lanes in response, creating a second disturbance. Many privately sensible searches for a faster position reduce collective stability.
Japan’s expressways add a recurring imbalance: drivers crowd the passing lane even while the travel lane has space. NEXCO East uses lane-keep markings on the Kan-Etsu to encourage left-lane use and reduce both passing-lane concentration and forced changes. At planned merges, the answer is not to merge as early as possible and guard territory; operators also test organized “fastener” or zipper merging. The principle is coordination: unnecessary weaving in an established queue is harmful, while a predictable one-by-one merge at a designed pinch point can use the approach lanes more fairly.
Tunnel entrances produce a related speed shock. Darkness, visual narrowing and a continuing ascent can make drivers lift off the accelerator. Kobotoke is difficult because a long uphill and tunnel coincide. Lighting, signs and moving pacemaker lights aim to make speed change visible and recovery coordinated. They are not commands to exceed a safe or legal speed; they are attempts to prevent unconscious deceleration and delayed acceleration.
Forecasting Is Demand Management
The congestion forecast does not merely inform people who will endure the queue. It tries to change the queue. Operators publish a start time, peak and end time for each bottleneck, then show examples in which a few hours’ shift saves more time than an improvised detour. For Sagamiko on August 8, the guide recommends passing Takaido before 4 a.m. or after 3 p.m.; for the August 15 Kan-Etsu return, passing Fujioka Junction before 2 p.m. or after midnight is forecast near the normal travel time.
Pricing policy carries the same purpose. Since fiscal 2022, ordinary ETC holiday discounts have not applied during Golden Week, Obon and New Year because government policy seeks to disperse traffic and flatten tourism demand. In 2026, the relevant excluded dates are August 8, 9, 11, 15 and 16. The policy removes a financial reason to join the busiest holiday flows; it does not charge a peak premium or guarantee that travellers can move to a weekday.
Forecasting has a paradox. If enough people obey it, the forecast can be “wrong” because the predicted queue shrinks. That is success, not failure. If weather or an incident changes the road, a previously accurate pattern can become irrelevant. The responsible use is two-layered: plan with the historical forecast, then check JARTIC and operator feeds immediately before and during travel.
Engineering a Smoother River
Japan attacks expressway congestion with concrete and choreography. Additional lanes increase physical capacity at persistent bottlenecks; a new auxiliary lane near Kōsaka Service Area opened in March 2025 as part of Kan-Etsu work that continues around the forecast Sakado-Nishi queue. Near Ayase on the Tōmei, NEXCO Central is preparing another auxiliary lane on a section carrying about 140,000 vehicles a day.
Where widening is slow or impossible, operators install signs urging speed recovery, moving lights that set a visual pace, lane-use guidance and improved merge layouts. A 2009 multi-site comparison found speed-recovery displays reduced “congestion volume”—queue length multiplied by duration—at test locations, though the size varied and the comparison was not a randomized experiment.
Automation may eventually damp disturbances before brake lights cascade. A study using trajectories at the Tōmei’s Yamato sag simulated adaptive-cruise-control vehicles and found that, under its specific assumptions, a share of 30% or more produced a congestion-avoidance rate above 50% across 10,000 trials. That is a model result at one site, not a promise that today’s driver assistance will dissolve Obon. Mixed traffic, settings, cut-ins and human overrides matter. The larger idea is credible: a controller that maintains a stable gap can behave less reactively than a line of impatient humans.
What One Driver Can Actually Do
- Use the bottleneck table, not only the daily peak. Plan to pass the named location outside its forecast window.
- Check live JARTIC and NEXCO information before departure; a forecast excludes unforeseen crashes and weather.
- Do not assume a holiday ETC discount will apply during the excluded Obon dates.
- Build rest, fuel or charging and crowded service areas into the schedule. A time-saving plan that removes breaks is not a safe plan.
- Keep a gap large enough to absorb a small speed change without immediately braking. Safety braking always takes priority.
- Watch for signs marking sags, uphill speed loss and the head of a queue; recover smoothly when the road opens.
- Avoid opportunistic weaving. Use the travel lane normally and merge predictably where lanes actually join.
- At the tail of a queue, slow early and watch mirrors; the greatest immediate risk may arrive from behind.
No individual can “fix” a 40 km queue. A driver can avoid adding a new pulse to it. That sounds trivial until multiplied across thousands of vehicles—the same multiplication that created the jam.
The Red River and the Ancestral Road
Obon asks families to reverse ordinary geography. Work, school and housing pull people outward through the year; remembrance pulls them back toward graves, household altars and older relatives. The expressway makes that return possible at mass scale. It also displays the cost of everyone honoring private obligations at nearly the same time.
On the night of August 15, the traffic map glows inbound. Near Sakado-Nishi, the forecast queue reaches 40 km and lasts until midnight. At its front, cars climb out and regain speed. At its rear, families returning from meals and memorial visits meet a red horizon. Every car advances; the shape moves backward.
The queue is neither natural disaster nor simple driver failure. It is a calendar, a transport network and a set of human reflexes coupled together. Japan learned to remove tollbooth queues, forecast daily tides and illuminate invisible bottlenecks. The next gains are harder because they ask millions of independent people to leave at different hours and drive as though their smallest action reaches strangers they cannot see.
It does. A gentle lift becomes a brake. A brake becomes a wave. A wave becomes 45 kilometers. And then, hours later, it vanishes without wreckage, leaving only the knowledge that the obstacle was the moving crowd itself.
Reporting notes and principal sources
This article uses public information checked through August 14, 2026 at 7:04 AM JST. Forecasts are identified as forecasts; 2025 observations are not treated as like-for-like. “World’s largest” is not used as a factual ranking because no standardized comparative dataset was located. Japanese route names are romanized for readability; official linked material is principally in Japanese.
- NEXCO companies, JB Honshi and JARTIC: nationwide 2026 Obon congestion forecast
- Official annex: forecast queues of 25 km or more, dates, times and passage estimates
- Official annex: avoidance examples and bottleneck explanations
- NEXCO East: 2026 capital-region Obon forecast
- NEXCO Central: 2026 regional Obon forecast and time-shifting example
- NEXCO East: causes, locations, ETC history and countermeasures
- NEXCO: 2009 speed-recovery display effect examples and congestion definition
- Ministry of Land, Infrastructure, Transport and Tourism: development of the capital-area expressway network
- MLIT White Paper: ETC adoption and declining toll-plaza delay
- MLIT: peak-period exclusion of holiday discounts from fiscal 2022
- Sugiyama et al.: “Traffic jams without bottlenecks,” New Journal of Physics (2008)
- Kai, Wada and Horiguchi: modelling capacity drop at expressway sags (2023)
- Kanezaki and Wada: congestion probability at sags and tunnels (2023)
- Research at the Tōmei Yamato sag: simulated ACC penetration and congestion avoidance
- MLIT: nationwide observed Obon traffic and congestion, 2017
- Japan Road Traffic Information Center: live road information