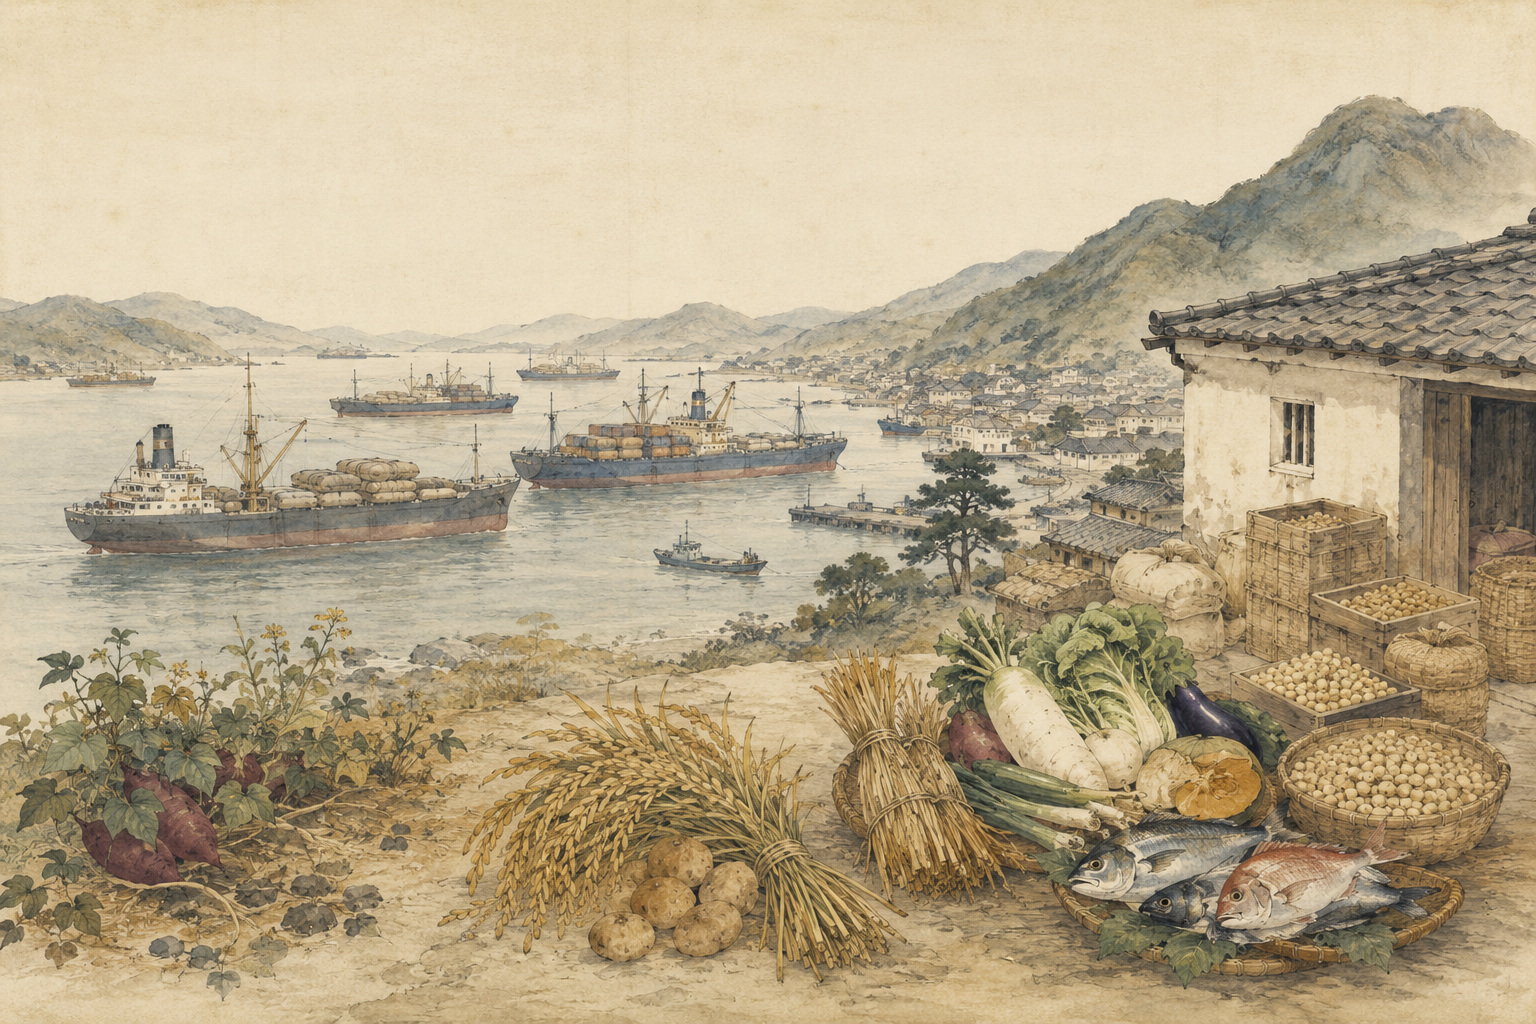
Imagine two breakfast trays. One holds rice, miso soup, grilled fish and vegetables. The other has toast, butter, a fried egg, sausage and salad. Japan’s real table moves freely between them, adding ramen, curry, pasta and beef bowls. That abundance is produced by more than Japanese farmers. North American wheat, soybeans and feed corn, Australian beef, Southeast Asian oils, fertilizer minerals, fuel, ships, ports and cold stores form a second, largely invisible farm behind the meal.
On August 7, the agriculture ministry said Japan’s calorie-based food self-sufficiency ratio fell one percentage point from 38% to 37% in fiscal 2025, the year ended March 31, 2026. Domestic supply contributed 830 calories per person per day, 28 fewer than the year before. Total food supply was 2,237 calories, down 11. Because the numerator fell more sharply than the denominator, the unrounded ratio dropped about 1.1 percentage points.
Rice was the largest reason. Annual consumption per person fell 2%, from 53.3 kilograms to 52.0. Domestic rice contributed 470 calories a day, 22 fewer than in fiscal 2024. An increase in private rice inventories also reduced the quantity of domestically grown grain moving into consumption during the accounting year. Domestic calories from seafood, vegetables and livestock products declined as well.
Thirty-seven percent is not “37 days of food”
Start with the most common misreading. A 37% ratio does not prove that Japan could eat for only 135 days if all imports stopped. The indicator describes the composition of one year’s food flow under the current diet, current waste, current livestock feeding and current planting. It does not directly measure what farmers could produce after emergency changes in land use, labor or consumption.
The underlying national food balance sheet follows a supply identity. Domestic consumption is broadly domestic output plus imports, minus exports and additions to inventory. Since a tonne of rice cannot be meaningfully added to a tonne of lettuce or cooking oil, every item is converted into calories. Domestic calories are divided by all calories supplied. For livestock raised in Japan, the share attributable to imported feed is removed from the domestic numerator.
This flow accounting explains why larger stocks can lower the annual ratio. Rice put into inventory has not vanished; it may strengthen later supply. But it has not moved into consumption in the current accounting period. Interpreting the figure therefore requires separating what a country harvested, what it stored and what it actually released into that year’s food stream.
One year, five valid numbers: 37, 45, 46, 66 and 71
The national debate becomes confused when the ruler disappears from the headline. Fiscal 2025 produced at least five relevant measures, each answering a different question.
| Measure | Fiscal 2025 | What it captures |
|---|---|---|
| Calorie-basis self-sufficiency | 37% 830 ÷ 2,237 kcal | Domestic origin as a share of all food calories supplied; excludes the imported-feed share of livestock. |
| Necessary-intake self-sufficiency | 45% 830 ÷ 1,850 kcal | Domestic calories against the government’s benchmark for ordinary daily nutritional need. |
| Calorie-basis domestic-production ratio | 46% | Counts livestock raised in Japan even when its feed was imported, revealing domestic farm and processing activity. |
| Production-value self-sufficiency | 66% | ¥14.4624 trillion of domestic output divided by ¥21.7672 trillion of food directed to domestic consumption. |
| Production-value domestic ratio | 71% | Does not deduct imported feed, capturing the full economic value produced inside Japan. |
The newer 45% necessary-intake measure keeps the same numerator—830 domestic calories—but replaces the 2,237 calories physically supplied with a benchmark of 1,850 calories considered necessary in ordinary life. The government chose that level because it exceeds typical adult male basal metabolism and closely matches the lowest average intake recorded in the national health and nutrition survey, 1,849 calories in 2010. The distinction recognizes that food supplied includes losses in retail, restaurants and homes.
The value measure moved in the opposite direction this year. Domestic rice prices rose 48%, while prices for livestock products including eggs also climbed. Their higher yen value lifted the production-value ratio from 64% to 66%. At the same time, vegetable and seafood output each fell 4%, reducing their domestic production value. A ratio can improve because food becomes more expensive even while physical output or household comfort deteriorates.
How a “97% domestic” egg becomes 11% self-sufficient
No food explains Japan’s hidden dependency better than an egg. On the calorie-based domestic-production measure, eggs are 97% Japanese: almost every supermarket egg came from a laying operation in Japan. On the stricter self-sufficiency measure, eggs are only 11%. The house and hen are in Japan, but much of the corn and soybean meal inside the hen arrived from an overseas field.
The same gap appears in chicken, 65% domestic but 7% self-sufficient; pork, 49% versus 5%; and beef, 50% versus 13%. Across livestock, the domestic-production ratio is 66%, while the feed-adjusted self-sufficiency rate is 17%. Feed self-sufficiency itself is just 24%. Exchange rates, ocean freight, exporting-country weather and working ports are therefore embedded in a Japanese barn.
The inverse problem applies to vegetables. Japan supplies 73% of vegetable calories domestically, but vegetables contain comparatively little energy, so even a vigorous industry moves the national calorie ratio only slightly. A region’s high-quality produce, fruit or fish can be economically, nutritionally and socially indispensable while remaining almost invisible in a calorie-heavy headline.
| Food | Calorie-basis self-sufficiency | What lies behind it |
|---|---|---|
| Rice | 96% | Japan’s largest source of domestic calories, but per-capita demand keeps falling. |
| Wheat | 16% | Bread, noodles and confectionery depend heavily on imports; varieties and stable yields matter domestically. |
| Soybeans | 25% | High-value domestic food beans coexist with mass imports for oil and feed. |
| Livestock products | 17% | Large domestic output rests on a predominantly imported feed base. |
| Oils and fats | 4% | Rapeseed, soybean and palm inputs are overwhelmingly imported. |
| Vegetables | 73% | Relatively strong domestic supply, but low calories mean limited impact on the headline ratio. |
| Seafood | 46% | A former national strength weakened by stock changes, warmer seas and a shrinking workforce. |
The 73% table of 1965
The ministry’s long-run chart starts in fiscal 1965, when the calorie-based ratio was 73%. It fell to 60% in 1970, 54% in 1975, 53% in 1985, 48% in 1990, 43% in 1995 and 40% in 2000. Since the early 2000s, the line has been broadly flat in a narrow band between 37% and 40%.
Reading that decline as nothing but agricultural failure misses half the history. Rapid growth raised incomes and spread refrigerators, supermarkets, restaurants and cold-chain logistics. Japan moved from a diet dominated by rice and starchy staples toward meat, dairy, eggs, bread, noodles and fried foods. The change represented relief from scarcity and an expansion of choice. It also increased imports of feed grains, wheat and oilseeds that Japan’s land, climate and costs did not readily supply at scale.
Rice consumption peaked at about 118 kilograms per person in fiscal 1962. In fiscal 2025 it was 52.0 kilograms—less than half. When calories shift away from an almost entirely domestic staple toward oils and meat produced with imported feed, the aggregate ratio falls. Thirty-seven percent is a farm story, but it is equally a story of urban menus.
Rice policy has wrestled with surplus as well as scarcity. As demand declined and stocks accumulated, full-scale production adjustment began in 1971. Governments repeatedly encouraged paddies to produce wheat, soybeans and feed crops. Yet a paddy is engineered to hold water, while upland crops need drainage. Without subsurface drains, suitable varieties, stable yields, buyers and workable prices, “replace rice with wheat” is much harder in a field than on a planning chart.
What the empty rice shelves of 1993 taught
In 1993, a cold summer and widespread rice blast disease drove the crop index down to 74. The supply of domestic rice fell roughly 24% from the previous year. Japan brought in 2.55 million tonnes through emergency imports, but consumers rushed to buy preferred domestic varieties and shortages spread through retail, food service and processing. The Heisei rice crisis showed why an aggregate annual ratio can conceal the shape of risk.
A rice failure, an oilseed-import interruption and a livestock epidemic might produce the same movement in a national index while hitting different shelves and requiring different substitutes. Japan’s 37% must therefore be decomposed by commodity, source country, season, transport route and household need.
The converse also matters. A low self-sufficiency ratio can coexist with reliable supply when sources are diversified, shipping lanes remain open, purchasing power is strong, ports and warehouses function and reserves are adequate. A high ratio can still be unsafe if drought, flood, livestock disease, fertilizer shortages or logistics failure strike domestic output together. Food security is not a binary choice between home production and trade. It layers domestic capacity, reliable imports, reserves, substitutes, distribution and the ability of every household to pay.
Twenty-five years of chasing 45%
The 1999 Basic Act on Food, Agriculture and Rural Areas formally placed self-sufficiency targets at the center of policy. The first Basic Plan in 2000 aimed for a 45% calorie-based ratio by fiscal 2010. The 2005 plan moved 45% to 2015. The 2010 plan set an ambitious 50% for 2020. The 2015 plan returned to 45%, this time for 2025; the 2020 plan carried 45% forward to 2030. Deadlines and baselines changed, but the result never broke out of the high thirties.
In 2024, Japan substantially revised the Basic Act for the first time in a quarter-century and made food security an explicit organizing principle. The context was stark: pandemic logistics, the grain, fertilizer and energy shock after Russia invaded Ukraine, a weaker yen, climate volatility and domestic depopulation. The Basic Plan adopted in April 2025 set fiscal 2030 targets of 45% on the calorie-supply basis, 53% on the necessary-intake basis and 69% by production value.
The latest 37% leaves eight percentage points to the 2030 calorie target. More importantly, Japan has not built a sustained upward trend in a quarter-century. Repeating a target will repeat history unless the plan connects hectares and crops to people, buyers, processing specifications and viable farm income. A national percentage changes only after countless local production systems do.
The deeper loss is people and recoverable capacity
Under the annual ratio lies a faster structural decline. Preliminary results from the 2025 Census of Agriculture and Forestry counted 1.021 million core agricultural workers in individual farm businesses, down 342,000—or 25.1%—in five years. The total has fallen from roughly 2.4 million in 2000, and the average age is in the upper sixties. New farmers and corporate employment have not replaced accumulated skill at the rate it is retiring.
Japan has about 4.27 million hectares of cultivated land. The ministry says this is only about one-third of the area that would be needed to satisfy all current demand for a population of 120 million under the present food mix. That is why emergency “food production potential” is a separate calculation: how many calories could limited land produce if it were concentrated in rice, wheat or potatoes, and if labor, seed, fertilizer and equipment were available?
Land does not return to production as quickly as it disappears from a ledger. Irrigation, field banks, drains and roads deteriorate; ownership fragments; boundaries become unclear; wildlife spreads. Human capacity is equally slow to rebuild. Water timing, sowing depth, disease recognition and machine adjustment cannot be learned on the day an emergency is declared. Keeping farming economically viable in ordinary years is the longest-lasting strategic reserve Japan can hold.
International comparison is a warning, not a league table
Ministry estimates for 2023 put the calorie ratio above 100% in Australia, Canada, France and the United States, with Germany at 81%, Britain 56% and Italy 51%. Japan is low among wealthy economies. But the comparison mixes countries with profoundly different land, population density, export industries and climates, and the values are ministry estimates rather than one globally standardized league table.
Countries above 100% still import coffee, cocoa, tropical fruit, fertilizer and specialized foods. Inside Japan, producing prefectures such as Hokkaido can exceed 100%, while metropolitan areas are far below it. That does not mean Tokyo should grow all food for its residents. It means regional exchange is integral to the system. The purpose of comparison is not to abolish interdependence; it is to locate dependence that has no substitute.
Policies that raise the ratio—and policies that make food safer
The arithmetic could be shifted by eating more domestic rice and less imported oil and feed-intensive meat. But diets cannot sustainably be reset by command, and subsidizing unwanted output does not create resilience. The practical goal is to enlarge the overlap between policies that raise the rate and policies that keep nutritious food moving through a crisis.
- Wheat and soybeans: Combine paddy drainage, regionally suitable high-yield varieties, shared machinery and multi-year contracts with processors.
- Feed: Mix pasture, silage corn, feed rice and food-industry byproducts region by region to reduce single-source import exposure.
- Rice: Face declining table demand while maintaining paddies through flour, processing, exports and well-designed reserves.
- Farmland: Consolidate use under capable operators while protecting irrigation, roads and drainage that make land recoverable after disaster.
- People: Build skills through young entrants, farm corporations, service contractors, small local farms and foreign workers—not one idealized successor alone.
- Prices: Create transparent pricing and income support that let farms recover input costs and reinvest while households can still afford healthy food.
- Imports and reserves: Diversify countries, ports and routes; audit stocks and release procedures for rice, wheat, feed grain and fertilizer inputs.
- Information: Publish self-sufficiency beside feed, fertilizer and fuel dependence, reserve duration, import concentration, farm labor and household food access.
Reducing food loss matters, but not merely because a smaller denominator might improve a ratio. It allows more of the land, labor, fertilizer, fuel and shipping already consumed to become human nutrition. Exports can sustain domestic production and farm income, but contribute to resilience only when contracts and logistics leave options to redirect supply in a genuine emergency.
The Act on Measures for Food Supply Difficulties created a framework for requiring businesses to prepare supply plans during a severe shortage. Yet orders issued after a crisis cannot instantly restore abandoned land or retired expertise. Emergency law is a final instrument. A farm sector that can function as a business in peacetime is the first seawall.
Make the number an entrance, not a conclusion
Thirty-seven percent is not a verdict against Japan’s modern diet. Folded into the fraction are the abundance gained after the war, the benefits of trade and the continuing value of domestic rice, vegetables, fisheries and livestock. Also folded into it are exposure to a weaker currency, war, drought, shipping disruption, imported feed and fertilizer.
The work is not finished by chanting “37 to 45.” Who produced the 830 domestic calories, on which land, with what seed, water and feed? Will the price allow that person to produce next year? If one import route closes, can another port or crop substitute? Can a low-income household afford the nutrition that still reaches the market? The real policy agenda begins after the headline fraction is dismantled.
A bowl of rice is almost entirely domestic. An egg can come from a Japanese farm after its feed has crossed an ocean. A salad may be substantially domestic and still look small in a calorie table. Japan’s food security begins by seeing all three truths at once. The 37% rate is not the end of the story. It is the door into the world map beneath the table.
Around 1945 War damage and distribution failures produce acute shortages; emergency production, rationing and overseas food assistance sustain the population.
1961 Japan enacts the Agricultural Basic Act, seeking modernization and a narrower income gap with other industries.
Fiscal 1962 Rice consumption peaks at roughly 118 kg per person.
Fiscal 1965 Calorie-based food self-sufficiency is 73%, the starting point of the standard long-run comparison.
1971 Full-scale rice production adjustment begins in response to declining demand and surplus.
1993 A cold summer devastates rice; Japan imports 2.55 million tonnes on an emergency basis and retail markets are disrupted.
1999–2000 A new Basic Act and first Basic Plan establish a 45% self-sufficiency target.
Fiscal 2018 The calorie ratio reaches 37% for the first time.
Fiscal 2020 It returns to 37%; policy begins publishing domestic-production and feed measures alongside it.
2024 The Basic Act is substantially revised, placing food security at its center.
April 2025 A new Basic Plan sets a 45% calorie-supply target and 53% necessary-intake target for fiscal 2030.
August 7, 2026 The ministry reports fiscal 2025 at 37%, tying the record low.
Reporting note and principal sources
This report uses information public through August 8, 2026, 6:00 a.m. JST. The fiscal 2025 food balance sheet and self-sufficiency results are preliminary and may be revised when finalized. International values are Ministry of Agriculture estimates; country conditions and statistical methods limit direct ranking.
- Ministry of Agriculture: fiscal 2025 food self-sufficiency release
- Ministry of Agriculture: detailed fiscal 2025 self-sufficiency results
- Ministry of Agriculture: fiscal 2025 national food balance sheet
- Ministry of Agriculture: Japan’s food self-sufficiency series
- Reuters: Japan’s 37% result and 2030 target
- Ministry of Agriculture: fiscal 2024 result and recent series
- Ministry of Agriculture: Japan’s changing diet in numbers
- Ministry of Agriculture: history of Basic Plans and self-sufficiency targets
- Government of Japan: 2025 Basic Plan for Food, Agriculture and Rural Areas
- Ministry of Agriculture: revised Basic Act on Food, Agriculture and Rural Areas
- Ministry of Agriculture: Act on Measures for Food Supply Difficulties
- Ministry of Agriculture: preliminary 2025 Census of Agriculture and Forestry
- Ministry of Agriculture: abandoned land, farm area and labor
- Kanto Agricultural Administration Office: the 1993 rice shortage
- Ministry of Agriculture: domestic-production and feed self-sufficiency measures
- Ministry of Agriculture: farm-policy history since the 1961 Basic Act
- Ministry of Agriculture: post-1945 scarcity, land reform and farm policy
- Ministry of Agriculture: food balance sheet statistical system
- Ministry of Agriculture: calculating self-sufficiency and the changing plate