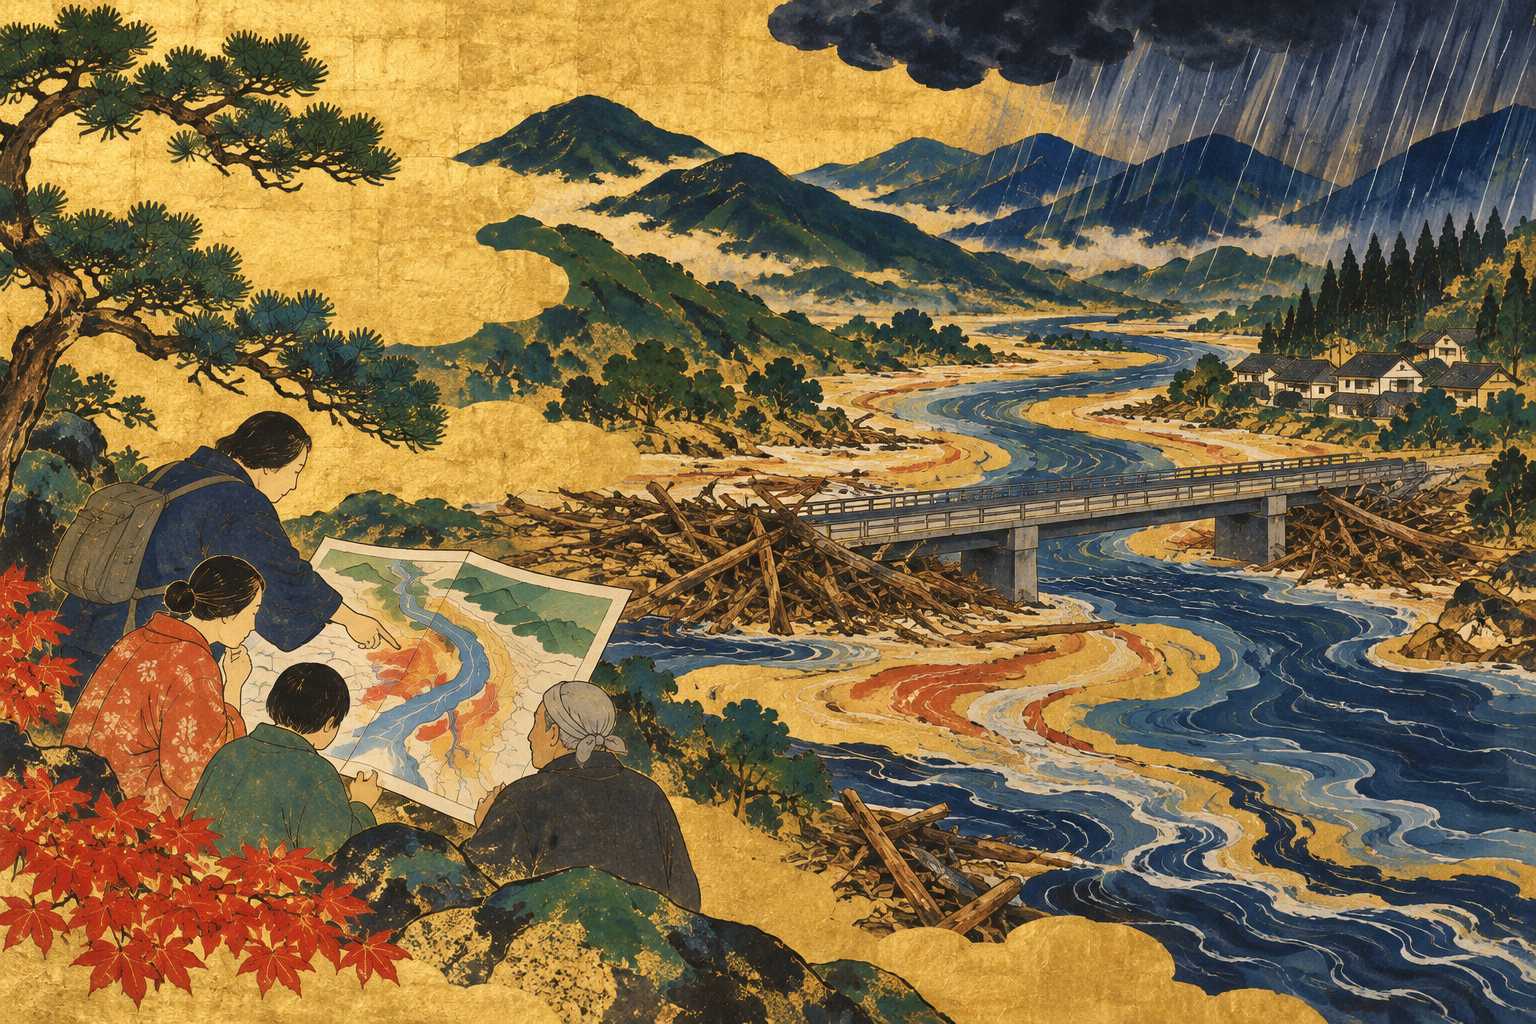
A river can lose room to carry water while a flood is still unfolding. Sediment raises its bed; timber gathers against a bridge. Water that might otherwise have passed downstream can rise or find another route. For a community reading a flood map, the question is therefore about the condition of the river as well as the amount of rain.
Japan’s Ministry of Land, Infrastructure, Transport and Tourism is working on how to represent that problem in maps for small and medium-sized rivers. On September 9 it announced a fourth technical committee meeting, scheduled for September 15, to discuss a draft revision of its small-river flood inundation mapping guidance. The work concerns methods for assessing the effects of sediment and driftwood on water levels and the area flooded. [1]
This is a step in developing a method. It does not mean municipal hazard maps have already been revised nationwide. Its importance lies in improving the information on which those maps—and the decisions made around them—depend.
Noto’s disaster did not begin with the rain
The January 1, 2024 Noto Peninsula earthquake caused widespread slope failures, landslides and blocked river channels. In September, exceptional rain struck an area still recovering. The Japan Meteorological Agency reports that a band of intense rainfall affected Noto on September 21, breaking observation records including hourly rainfall. Over September 20–22, totals exceeded 500 millimetres at some locations in Ishikawa Prefecture. [2][3]
A ministry committee’s June 2025 recommendations identified a particular mechanism in rivers including the Tsukada and Suzuya: sediment and wood caught at bridges and other structures, filling channels and causing or enlarging inundation. This provides a concrete connection between the disaster and the mapping initiative. [2]
It would nevertheless be wrong to explain every flooded location simply as a consequence of the earthquake. The recommendations also identify rainfall far exceeding the scale used in river planning. Understanding the sequence requires distinguishing the condition left by the earlier disaster from the severity of the later storm. [2]
When the channel itself changes
The ministry uses the term dosha kōzui hanran, 土砂・洪水氾濫, for flooding in which large amounts of material washed from upstream accumulate downstream of a valley outlet, raising or filling the channel and causing sediment and muddy water to spread. Wood may accompany the flow. This extends the picture beyond a debris flow descending a steep ravine to flooding across the more open land below. [4]
A raised bed leaves a smaller channel cross-section for water. Timber caught at a bridge can restrict passage at a particular point. Accounting for such changes can produce a different picture from increasing the water flow while leaving the channel’s ability to convey it unchanged. Connecting those effects to inundation estimates is the purpose of the current work. [1][4]
There is no obvious single assumption suitable for every river. Terrain, sediment sources and bridge geometry differ. How much material moves, and where it collects, are consequently questions that a useful method must address. These are Japan.co.jp’s explanatory observations, not a report that a particular formula or nationwide blockage allowance has been adopted.
Two maps with different jobs
An inundation map estimates where water could spread and how deep it could become under specified conditions. A municipal flood hazard map combines that underlying information with local material such as evacuation destinations and the communication of warnings. The ministry distinguishes the technical maps issued by river authorities from the community-facing maps prepared by municipalities. [7][10]
| Inundation map | Estimated flood extent and depth under stated assumptions. |
|---|---|
| Municipal hazard map | Risk information combined with local evacuation and communication information. |
| Current technical review | Methods to include sediment and wood effects on water levels and inundation. |
| Beyond a static map | The actual path of a particular flood, post-disaster infrastructure conditions and whether an evacuation destination is currently open. |
That distinction also matters when reporting progress. Revising a method, calculating results for individual rivers, publishing the results and incorporating them into local maps are separate stages. A committee announcement is not evidence that the map a household already owns has changed.
A quarter-century of widening the picture
According to the ministry’s mapping manual, Japan established the inundation-area system in 2001 for rivers covered by flood forecasting, expanding it in 2005 to rivers designated for water-level notification. A 2015 Flood Control Act amendment changed the rainfall premise from the scale used for planning to the maximum conceivable scale. The aim was to make the consequences of rain beyond infrastructure planning assumptions visible. [7]
A further amendment in 2021 expanded coverage to Class A and Class B rivers with assets such as homes to protect within their inundation areas. In April 2026, the ministry said inundation mapping and publication had been completed for all 20,819 rivers in that scope by the end of fiscal 2025. That is a reported completion figure for the underlying river maps, not a claim that every municipal hazard map had been updated. [8]
The sediment problem has its own history. The ministry lists the July 2017 northern Kyushu rain disaster and the July 2018 heavy rains as examples of sediment and flood inundation. In April 2022 it announced guidance for identifying basins at risk of major damage from the phenomenon, enabling prefectures to begin that screening work. Noto did not introduce a previously unknown process. [4][9]
It did add urgency and experience. The present technical committee was established in December 2025. Its third meeting, scheduled for June 30, 2026, had a proposed outline of the mapping-guidance revision on the agenda; the September 15 meeting is to discuss a draft revision. Expansion of geographic coverage and improvement of the processes represented in a map are thus proceeding along different tracks. [5][6][1]
Reading the assumptions with the colours
The national Hazard Map Portal, operated by the ministry and the Geospatial Information Authority of Japan, allows users to overlay information on floods, sediment disasters and land characteristics. It also links to municipal maps. Users can search by address and consult the organisation responsible for a dataset about its meaning. [11]
Japan.co.jp’s suggestion for community discussions is to read the publication date, river coverage and rainfall assumptions together. A household’s location is one starting point; schools, care facilities and familiar roads also belong in the conversation. An uncoloured location cannot be interpreted sensibly without understanding the coverage and assumptions of the selected map.
After a disaster, the assumption that familiar roads and facilities remain usable also needs reconsideration. The 2025 recommendations call for identifying changes to terrain and infrastructure after an initial event, communicating increased risks and taking emergency measures. [2]
Japan.co.jp analysis: making a revised map matter
A more informative calculation has limited practical reach if it remains inside a technical document. When authorities publish a revised map, explaining what changed—and which assumptions account for the difference—should be part of the task.
Success should therefore be judged by more than whether the coloured area grows or shrinks. Does the information reach people who need to reconsider an evacuation destination? Can a facility manager use it to review a plan? Can knowledge gained after one disaster be communicated before the next heavy rain? These are proposed tests of practical value, not benefits already demonstrated by this initiative.
Noto’s transferable lesson is that neither a river nor the community around it remains fixed after a disaster. Including sediment and wood in flood mapping is one way to make that changing condition visible. The next task is to turn that knowledge into changes in how a community prepares.
- MLIT, fourth technical committee meeting announcement, September 9, 2026
- MLIT committee, recommendations following Noto’s earthquake and heavy rain, June 2025
- Japan Meteorological Agency, September 20–22, 2024 heavy rain; preliminary report issued October 29
- MLIT Sabo Department, sediment and flood inundation: definition and examples
- MLIT, technical committee establishment and meeting notice, December 16, 2025
- MLIT, third technical committee meeting announcement, June 25, 2026
- MLIT, flood inundation mapping manual, fourth edition, 2015, revised 2017
- MLIT, FY2025 progress on basin-wide flood management, April 10, 2026
- MLIT, identifying basins at risk of sediment and flood inundation, April 18, 2022
- MLIT, flood inundation maps and municipal hazard maps
- MLIT and Geospatial Information Authority of Japan, Hazard Map Portal