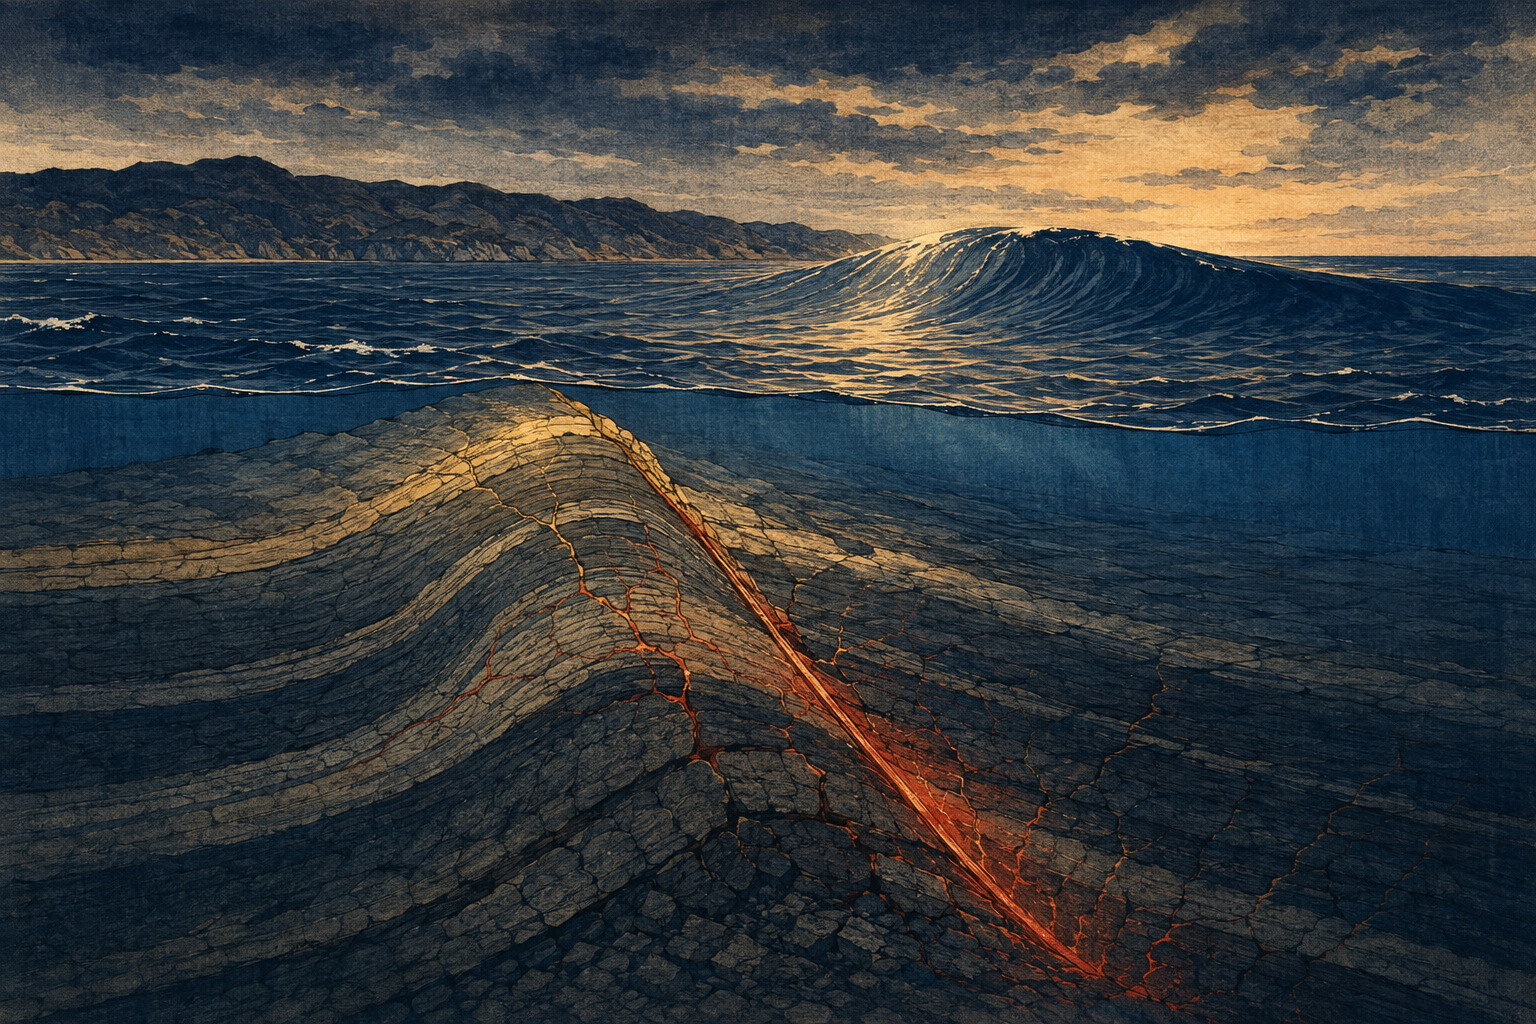
This is not one fresh crack made in 2024
On May 11, 2026, researchers from the University of Tokyo, the Japan Agency for Marine-Earth Science and Technology (JAMSTEC) and Chuo University reported a large deformation zone, or LDZ, inside the marine rupture area of the 2024 Noto Peninsula earthquake. The feature extends roughly 30 kilometres northeast–southwest off northeastern Noto. Its width varies from about 2.5 to 3.8 kilometres across the survey lines. Within it, faults, folds and thrust-up layers cluster together.
The first essential distinction is that the LDZ is not a 30-kilometre fissure that suddenly opened on January 1, 2024. Tens of metres of stratigraphic offset, a roughly 70-metre-high seabed structure and broad erosional surfaces record cumulative deformation and long-term uplift over repeated events. The earthquake likely reactivated part of a fault system inherited from the formation of the Sea of Japan and later reused under compression.
The advance lies in connecting three kinds of evidence. The researchers did not merely place a rectangular fault beneath a known tsunami source. They imaged the shallow fault geometry in seismic-reflection profiles, incorporated that geometry into a propagation model and compared the calculated coastal heights with measured inundation and run-up. The result is strong but not final. The paper explicitly says direct evidence of coseismic slip throughout the LDZ is lacking. It offers a coherent, testable explanation linking structure, limited-area bathymetric uplift and coastal tsunami traces.
At 4:10 p.m. on New Year’s Day, rupture spread across 150 kilometres
At 4:10 p.m. JST on January 1, 2024, a reverse-fault earthquake occurred at a depth of 16 kilometres beneath the Noto region of Ishikawa Prefecture. The Japan Meteorological Agency assigned it magnitude 7.6 and maximum seismic intensity 7. Moment-magnitude studies generally report about Mw 7.5. “M7.6” and “Mw7.5” use different magnitude definitions and analyses; they do not describe two different earthquakes.
The aftershock zone extended about 150 kilometres from the peninsula’s west coast to the sea northeast of Noto. On land, an emergency geodetic survey measured as much as 4.10 metres of uplift and 1.48 metres of westward motion at a benchmark in western Wajima. Former shallows emerged above water along much of the northern coast, changing shorelines and harbour depths overnight. Comparisons by the Japan Coast Guard and Hokuriku Electric Power later revealed broad areas of seabed uplift reaching about three metres northeast of Suzu and north of Wajima.
JMA issued tsunami warnings for Ishikawa, Toyama and Niigata at 4:12 p.m., two minutes after the earthquake, and upgraded Noto to a major tsunami warning at 4:22. Field surveys measured inundation and run-up of roughly three to six metres at locations on Noto’s east coast. A later whole-island survey on Hegurajima measured a maximum run-up of 6.5 metres, while JMA identified a 5.8-metre run-up trace at Funami Park in Joetsu, Niigata. These figures are not interchangeable “wave heights.” They describe different measurements at different locations.
| Number | What it measures | What it does not mean |
|---|---|---|
| Fault slip: 6–7m | Relative motion of the two sides along a fault plane; an assumption in the best-fitting model group | It does not mean the seabed rose vertically by 6–7m |
| Seafloor uplift: up to about 3m | Local vertical change from pre- and post-earthquake soundings | It was not uniform across the entire rupture area |
| Offshore tsunami height | Water-surface departure from ordinary tide at sea or a gauge | It is not the same as a trace left on land |
| Inundation height | A water mark above a reference sea level at a flooded site | It is not simply water depth above the ground |
| Run-up height | Elevation of the highest point reached inland | It does not mean the offshore wave was that tall |
Magnitude alone does not determine a tsunami
A tsunami begins when a large area of seabed moves up or down rapidly and displaces the column of water above it. Earthquake magnitude measures overall size, but tsunami efficiency depends on where the slip occurs, whether motion is vertical or horizontal, how shallow the rupture reaches, and the fault’s dip and curvature. A large strike-slip earthquake that produces little vertical seabed motion can make a smaller tsunami than a similarly sized thrust event.
Some of the largest 2024 slip lifted land on Noto. That deformation was enormous, but land uplift does not directly push up seawater. In the NT4 and NT5 subfault regions northeast of the peninsula, by contrast, faults appear to reach close to the seabed, while the LDZ overlaps or lies beside mapped seafloor uplift. The 2026 study argues that vertical displacement there was the principal near-source driver of the tsunami.
Even the phrase “the LDZ amplified the tsunami” needs care. The height reached at each coast also depended on water depth, bays, headlands, submarine valleys, ports, seawalls and topography on land. The LDZ is a source-side explanation for moving the water. It cannot by itself explain every metre observed at every community.
Twelve days in which Hakuho-maru sliced the crust with sound
From March 4 to 16, 2024—about two months after the earthquake—the research vessel Hakuho-maru carried out a rapid-response multichannel seismic-reflection survey northeast of Noto. Fourteen survey lines were each approximately 45 kilometres long, or about 630 line-kilometres in simple total. Two GI guns released compressed-air pulses every 18.75 metres. A 1,200-metre, 48-channel streamer carried hydrophones spaced 25 metres apart to record echoes from boundaries below the seabed.
Sound reflects where density and seismic velocity change between layers. Return time alone does not give an accurate depth: a wave travelling through faster rock covers more distance in the same interval. The team iteratively refined a velocity model, then used pre-stack depth migration, or PSDM, to relocate reflections toward their true subsurface positions. Compared with an ordinary time section, PSDM represents the angle and depth of a steep fault more realistically.
This is not a photograph of the crust. Geologists interpret breaks and bends in reflections as faults and folds. The 1.2-kilometre streamer was relatively short, limiting sensitivity to velocity changes associated with deeper, steep and segmented reflectors. The paper estimates a maximum velocity-model uncertainty of about five per cent at two kilometres below the seabed. That limitation explains its call for longer cables and three-dimensional imaging.
A curved reverse fault branches like a flower
The LDZ’s first-order structure is interpreted as a main reverse fault, F1, dipping roughly 50–75 degrees southeast at shallow depth. In the tsunami model, its listric—or curved—geometry becomes gentler at depth: about 20–25 degrees deep, 45–50 degrees at intermediate levels and around 65 degrees near the seabed. That shape can turn deep horizontal shortening into substantial vertical motion where the fault steepens upward. F1 may be a normal fault created when the Sea of Japan opened and later inverted under compression.
Several reverse faults and at least one normal fault branch upward from the main structure, pushing the layers into antiforms. In cross-section the branches spread like a positive flower structure, evidence that local strike-slip motion joined the compression. The result is closer to a damaged corridor distributing motion among several splays than to the single clean plane of a textbook diagram.
On one profile, a pop-up structure above the LDZ stands roughly 70 metres above the surrounding seabed. A branching reverse fault has about 40 metres of throw at approximately 300 metres depth, while a normal fault close to the bottom corresponds to about five metres of seafloor offset. Those are cumulative geological structures, not measurements of motion in the 2024 earthquake alone. The independently measured coseismic uplift is a separate figure: locally as much as about three metres.
Slip the fault until the calculation meets the marks on shore
The team ran tsunami calculations with JAMSTEC’s JAGURS software on a grid of roughly 50 metres containing about 174.1 million cells. Near the coast, the equations included nonlinearity, dispersion and bottom friction. Calculated coastal tsunami heights were compared with surveyed inundation heights, with run-up used as supplementary evidence. The model began with existing NT2–NT5 subfaults, then extended NT4 two kilometres northwest and five kilometres southwest to encompass the newly mapped structure and uplift. The revised unit was named E-NT4.
The researchers tested slip of 2, 4, 6, 7 and 8 metres on E-NT4 and NT5, combined with 0, 0.5, 1, 2, 4 and 6 metres on the more northeastern NT2 and NT3. Three cases best reproduced observations around Noto and the Honshu coast: 6–7 metres on E-NT4 and NT5, and 0–1 metre on NT2 and NT3. The representative figure used six metres on the former and 0.5 metre on the latter. With the curved geometry, that slip was consistent with local seabed uplift approaching three metres.
Fit was evaluated with Aida’s K and κ indexes. A K close to one indicates that the overall ratio of observed to calculated height is balanced; a lower κ indicates less site-to-site scatter. For Honshu, the preferred cases produced K=0.95–1.05 and κ=1.41–1.45, within the study’s adopted engineering criteria. An earlier model had K=1.59 and κ=1.49 and tended to underestimate the tsunami more broadly.
| Model component | Range tested | Best group | Interpretation |
|---|---|---|---|
| E-NT4 and NT5 | 2, 4, 6, 7, 8m | 6–7m | The central and southwestern offshore source containing the LDZ supplies most of the modelled tsunami |
| NT2 and NT3 | 0, 0.5, 1, 2, 4, 6m | 0–1m | The long northeastern reverse faults had little shallow slip in 2024 |
| Seafloor uplift | Calculated from fault geometry | Consistent with up to about 3m | Compared against spatially limited pre/post bathymetry |
| Coastal heights | Compared with field observations | Improved across Honshu | Supports the hypothesis, but does not make it a unique solution |
“Reproduced” is not the same as “observed directly”
Tsunami source inversion is non-unique. Different combinations of fault position, dip, slip, timing and rupture speed can produce similar waveforms at a limited set of gauges. An independent 2025 high-resolution inversion did not begin by fixing one fault geometry; it reconstructed the initial water surface and found uplift peaks of 3.3 metres near NT5 and 3.0 metres near NT4. Two different methods pointing to similar source areas is important reinforcement, but it does not settle every parameter.
The 2026 model improved the Noto and Honshu match yet continued to underestimate heights on Sado Island and the Niigata coast. The authors identify deformation on NT2–NT3, unresolved faults and submarine landslides as possible missing contributions. A claim that the new model “solved the entire tsunami” would hide the observations it still cannot reproduce.
The LDZ visible in the seismic profiles is also a long-term structure, not a before-and-after three-dimensional image of 2024 rupture. Bathymetric uplift comparisons cover limited areas. Faults reaching close to the seabed, overlap with the source and uplift regions, and a better-fitting model make a powerful circumstantial case. They do not reveal how many metres each branch slipped at each second of the earthquake.
Submarine landslides are a separate question
About 30 kilometres east of Noto, the Japan Coast Guard compared 2023 and 2024 bathymetry and detected a large collapse on the wall of a submarine canyon. The largest changed area was about 1.6 kilometres long and 1.1 kilometres wide, and became as much as 50 metres deeper. JAMSTEC and partners later identified additional slope-failure traces along the Toyama Deep-Sea Channel. These changes were likely earthquake-induced, but they are a different structure and process from the LDZ.
Tide and wave gauges in Toyama Bay registered changes within roughly two to five minutes of the earthquake—too early to be explained comfortably by propagation from the principal rupture at the expected speed. Several studies propose a local source from a submarine landslide or from horizontal displacement on a steep slope. One combined model improved the observed waveform by assuming a landslide approximately three kilometres long, four kilometres off Toyama City.
That does not mean every mapped collapse has been linked conclusively to the early wave, or that the proposed location is the observed failure. JAMSTEC’s 2025 release explicitly said the relationship between the Toyama Deep-Sea Channel changes and the tsunami was unknown. A reasonable working picture is a broad earthquake-fault tsunami plus possible local additions from several failures or slope motions; their relative shares remain unresolved.
A bay and two headlands can remake the same wave
At Iida Bay on Noto’s east coast, the first water-level peak came about 20 minutes after the earthquake, but the largest overtopping developed in later waves around or after 30 minutes. Waves diffracted around headlands, travelled along the shore as edge waves and reflected inside the bay. Their overlap amplified short-period motion locally. Even a perfect initial source will miss neighbourhood-scale damage if harbour walls and tens-of-metres-scale bathymetry are too coarse.
At Hegurajima, the maximum northern run-up reached 6.5 metres. A detailed survey found inundation and run-up behind breakwaters 40–50 per cent lower than in unprotected areas. Refraction around the island and flows arriving from several directions carried debris across broad parts of the settlement. The breakwaters did not eliminate damage, but locally reduced the height.
On Noto’s northern coast, by contrast, broad inundation was limited despite proximity to the source. Coastal terraces and cliffs mattered, and coseismic uplift of roughly one to four metres effectively lowered the sea relative to the land. The same uplift rendered harbours unusable and caused long-term ecological and fisheries disruption while protecting some land from immediate flooding. Crustal deformation does not point in only one direction on a ledger of damage.
The Sea of Japan reuses the wounds made when it opened
During the Miocene, the Sea of Japan opened as a back-arc rift while the Japanese islands separated from the continental margin. Stretching broke the crust with normal faults and formed deep sedimentary basins and grabens. Some structures running from offshore Noto into the Toyama Trough are inherited from a “failed rift” that did not become a fully spreading ocean basin.
From the late Pliocene through the Quaternary, the regional stress field turned compressional. Old normal faults that had dropped blocks downward were reactivated in the opposite sense as reverse faults—a process called basin inversion. Because inherited listric faults are gentle at depth and steepen upward, renewed shortening grows complicated folds and thrust wedges. That history is the geological reason the LDZ’s F1 can be interpreted as an old back-arc fault put to work again.
The 2011 Tohoku earthquake on the Pacific side was a giant rupture of a plate boundary extending hundreds of kilometres. The 2024 Noto event broke active structures inside continental crust on the Sea of Japan side. Both moved seabed and generated tsunamis, but their settings, fault scales, warning windows and most useful survey strategies are different.
Noto’s shoreline had recorded earlier uplift
Marine terraces and stranded biological markers have long shown that the Noto Peninsula rises episodically. The magnitude-6.9 Noto Hanto earthquake of March 25, 2007 lifted part of the northwest coast by as much as about 50 centimetres. A study of the upper growth limits of calcareous tubeworms and older shorelines identified a coseismic emergence dated approximately AD 1025–1235 along the same stretch, suggesting that the previous 2007-type uplift event may have occurred about a millennium earlier.
The 2007 tsunami was small—roughly 20–30 centimetres at Noto gauges—but its later phases differed markedly between Wajima and Noto stations only 30 kilometres apart. Numerical work found that shallow bathymetry north of the peninsula amplified a wave and directed it toward Noto, not Wajima. Seventeen years before 2024, the peninsula had already demonstrated that source motion alone does not determine a local waveform.
Across the eastern margin of the Sea of Japan, damaging earthquake tsunamis occurred off Shonai in 1833, Niigata in 1964, the central Sea of Japan in 1983 and southwest Hokkaido in 1993. The 1983 tsunami reached about 15 metres in northern Akita and reinforced the lesson that waves can reach nearby Sea of Japan coasts quickly. Tsunami deposits record still older events over thousands of years. Noto 2024 was not an isolated anomaly; it was a new chapter in a basin repeatedly opened, compressed and inverted.
| Period or year | Noto and Sea of Japan milestone | Connection to the present study |
|---|---|---|
| Miocene | The Sea of Japan opens as a back-arc rift, forming normal faults and sedimentary basins | Creates the inherited curved faults that are now reactivated |
| About AD 1025–1235 | An old emerged shoreline records coseismic uplift in northwestern Noto | Evidence for recurrent uplift, though not necessarily on the same LDZ |
| 1833, 1964, 1983, 1993 | Large earthquake tsunamis recur along the eastern Sea of Japan | Regional history of submarine-active-fault hazards |
| 2007 | M6.9 Noto earthquake, up to about 50cm uplift and a small tsunami | Demonstrates bathymetric amplification of later waves |
| 2018–2023 | Northeastern Noto swarm intensifies after 2020; M6.5 in 2023 | Links deep fluids with upward-migrating seismicity |
| 2024 | M7.6 mainshock, tsunami, land and seabed uplift; March Hakuho-maru survey | Provides pre/post differences and high-resolution profiles |
| 2025 | Source inversions, landslide work and marine-fault assessment advance | Independent data test uplift near NT4 and NT5 |
| 2026 | LDZ structure and tsunami model pass peer review | Shallow geometry is connected explicitly to tsunami generation |
The earthquake swarm and deep fluids: trigger is not tsunami source
An earthquake swarm had been active beneath northeastern Noto since around 2018 and intensified sharply from December 2020. On May 5, 2023, a JMA magnitude-6.5 event caused major damage around Suzu. High-precision relocation showed earthquakes migrating upward from approximately 20 kilometres through a complex fault network. GNSS recorded inflation and aseismic deformation around the swarm.
Helium isotopes in hot-spring and well gases indicate that material with an upper-mantle signature rose near the swarm. Studies of the 2024 mainshock found that rupture began weakly for 15–20 seconds in this fluid-rich area, then developed into much larger slip. The emerging explanation is that fluid pressure reduced effective friction, contributing to swarm migration and rupture initiation.
Those fluids were not water that directly lifted the sea. Deep-fluid research primarily asks why the fault began to fail; the LDZ and tsunami study asks how rupture reached shallow branches and moved the seabed. Linking them requires a three-dimensional model connecting the deep hypocentre and slip patches to the shallow deformation corridor.
Two minutes for a warning; only minutes for a near-field wave
JMA issued tsunami warnings at 4:12 p.m. and upgraded Noto at 4:22. That rapid magnitude-based system provided a crucial regional alert. But when a tsunami source lies immediately beneath or beside the coast, some locations may be reached around the time strong shaking ends. A probable separate local source produced water-level change in Toyama Bay within two to five minutes. A geolocation study found that people began moving away from the Noto coast very rapidly, within two to six minutes of origin time.
On this timescale, coastal residents cannot safely wait for an official message and then go to look at the sea. Strong or prolonged shaking near the coast is itself a signal to move uphill. The same geolocation research found some people returning toward the coast 20–100 minutes after the earthquake, long before warnings were downgraded or cancelled. At Iida Bay, later waves were larger than the first. Staying away until authorities lift the warning is part of evacuation, not an afterthought.
Detailed fault geometry will not make real-time warning magically ten times faster. Its immediate value is to improve precomputed scenarios, inundation maps, sensor placement, evacuation sites and harbour design. During an event, seabed pressure sensors, GNSS, strong-motion instruments and coastal cameras must update those scenarios with observations.
Why submarine fault maps change after an earthquake
On land, faults can be revisited through scarps, outcrops and trenches. Submarine faults lie beneath water and sediment. Older single-channel reflection profiles and time sections could trace many structures broadly, but did not always resolve steep splays and their deep connections at the accuracy needed for tsunami sources. NT2–NT6 models existed before 2024, yet their boundaries and shallow geometry remained uncertain.
After the earthquake, Japan deployed ocean-bottom seismometers, bathymetric surveys, multichannel reflection, satellites, GNSS and tsunami waveform analysis. In August 2024, the national Earthquake Research Committee accelerated an assessment of marine faults from north of Hyogo to offshore Joetsu. A fuller first edition for the central-southern Sea of Japan followed in June 2025. The current assessment identifies a roughly 94-kilometre Noto Peninsula North Coast Fault Zone capable of an earthquake around M7.8–8.1, but does not yet give an occurrence probability. A magnitude range is not a prediction that rupture is imminent.
Likewise, the approximately 60-kilometre northwest-dipping reverse-fault system northeast of the LDZ did not become harmless because shallow slip was small in 2024. Fault scarps and tilted layers record cumulative activity. The 2026 paper cites a government warning of future events up to about M7.8 on this system. Again, that is a scenario size, not a date forecast.
What the study shows—and what it does not
| The evidence shows | The evidence does not yet show |
|---|---|
| An LDZ about 2.5–3.8km wide and 30km long lies within the rupture and tsunami-source region | That the whole LDZ slipped simultaneously as one surface in 2024 |
| A steep shallow reverse fault and branching splays approach the seabed | The 2024 slip amount and timing on every branch |
| A 6–7m NT4–NT5 slip model improves tsunami heights along Honshu | That this is the only possible source solution |
| Limited bathymetric coverage records up to about 3m of seafloor uplift | A continuous three-dimensional displacement field for the entire rupture |
| Niigata and Sado remain underestimated | The separate contributions of landslides, NT2–NT3 and unresolved faults |
| Cumulative structures demonstrate repeated activity | An exact recurrence interval or date for the next earthquake |
Next: three-dimensional imaging, drilling and permanent observation
The first need is a three-dimensional seismic survey with longer streamers and denser lines. A two-dimensional profile can cross a fault obliquely and display an apparent dip, while continuity between lines must be inferred. A 3D volume could trace the flower structure’s branches, the connection between NT4 and NT5, and overlap with uplift more directly.
The second is scientific drilling. Fault clay, fractured rock and pore water would allow measurements of friction, permeability, fluid pressure and evidence of past heating. Those properties could test why the LDZ efficiently converted deep slip into shallow uplift, and why one branch moved while another stopped. Drilling, however, demands precise targeting, high cost and a long plan for safe borehole observation.
The third is systematic baseline data. One of the most valuable facts in this investigation was that soundings from 2020–23 had been preserved, making a genuine pre/post comparison possible after the earthquake. Routine bathymetry, reflection profiles, seabed pressure and ocean-bottom seismic monitoring along the Sea of Japan would let the next event be measured as a difference, not reconstructed only from its aftermath.
A section beneath the sea is both archive and design brief
On January 1, 2024, Noto’s coast changed in minutes. The geometry that guided the change did not appear that afternoon. A normal fault inherited from opening of the Sea of Japan, a main structure inverted under compression, shallow branches carrying local strike-slip, and repeated uplift and erosion built the 30-kilometre corridor.
The 2026 study showed that adding this geometry to a tsunami calculation explains the marks on much of Honshu better than an earlier model. That is meaningful support for the LDZ hypothesis. It also exposed the Sado and Niigata mismatch, limited bathymetric coverage, short-streamer uncertainty and absence of direct slip evidence. Scientific progress does not only fill gaps; it maps where the gaps remain.
A fault map cannot stop an earthquake. It can make estimates of which patch of seabed may rise, where waves may combine in a bay, and how quickly they may reach a community less generic and more physical. The large deformation zone is not just a striking structure discovered after a disaster. It is a geological record that pre-disaster planning now has to learn how to read.
Primary sources and further reading
- Park et al., “Tsunamigenic fault structures revealed in the 2024 Noto earthquake (M7.6) rupture area,” Scientific Reports 16:12046 (May 11, 2026): central source for the LDZ, survey, tsunami simulation and limitations.
- JAMSTEC: Large structure linked to tsunami discovered off Noto (May 11, 2026): Japanese joint research announcement.
- Chuo University joint release: research background, paper information and seismic-reflection glossary.
- NOTO2024 Seismic Depth Sections: public PSDM profiles from all 14 survey lines.
- Japan Meteorological Agency: The 2024 Noto Peninsula Earthquake: origin, magnitude, warning chronology, deformation and tsunami traces.
- Geospatial Information Authority of Japan: emergency survey results: 4.10m maximum measured uplift and 1.48m horizontal motion.
- Japan Coast Guard: Seafloor uplift northeast of Suzu and north of Wajima: pre/post bathymetric comparisons and uplift up to about 3m.
- Fujii & Satake, “Slip distribution of the 2024 Noto Peninsula earthquake estimated from tsunami waveforms and GNSS data,” Earth, Planets and Space 76:44 (2024): the NT subfault framework.
- Takagawa et al., “High-resolution source inversion of 2024 Noto Peninsula earthquake tsunami,” Scientific Reports (2025): 3.3m and 3.0m initial-water-level uplift peaks near NT5 and NT4.
- Yuhi et al., “Post-event survey of the 2024 Noto Peninsula earthquake tsunami in Japan,” Coastal Engineering Journal (2024): inundation and run-up around Noto, Toyama and Niigata.
- Post-event survey and numerical simulation at Hegurajima Island (2025): 6.5m maximum run-up and 40–50% reduction behind breakwaters.
- Kutschera et al., “The Multi-Segment Complexity of the 2024 Mw 7.5 Noto Peninsula Earthquake Governs Tsunami Generation,” Geophysical Research Letters (2024): two rupture episodes and the importance of offshore slip.
- Yamanaka et al., “Nearshore Propagation and Amplification of the Tsunami,” Geophysical Research Letters (2024): edge waves and later-wave amplification in Iida Bay.
- Japan Coast Guard: Large submarine slope collapse east of Noto (February 22, 2024): a 1.6×1.1km area and up to 50m of depth change.
- JAMSTEC: Submarine-landslide traces from the 2024 Noto earthquake (2025): Toyama Deep-Sea Channel bathymetric changes and the unresolved tsunami connection.
- Mulia et al., “Compounding impacts of the earthquake and submarine landslide on the Toyama Bay tsunami,” Ocean Engineering (2024): a combined model for the bay’s early wave.
- Ma et al., “Slow rupture in a fluid-rich fault zone initiated the 2024 Mw 7.5 Noto earthquake,” Science (2024): 15–20-second initiation, shallow offshore slip and fluid-rich rupture.
- Umeda et al., “Geochemical Signature of Deep Fluids Triggering Earthquake Swarm in the Noto Peninsula,” Geophysical Research Letters (2024): helium isotopes and mantle-derived fluids.
- Yoshida et al., “Updip Fluid Flow…Triggered the 2023 Suzu Earthquake,” Geophysical Research Letters (2023): relocation of more than 20,000 earthquakes and upward migration.
- Tanioka, “Analysis of the tsunami generated by the 2007 Noto Hanto earthquake,” Earth, Planets and Space (2008): amplification of later waves by shallow bathymetry north of Noto.
- Shishikura et al., “Evidence for coseismic and aseismic uplift in the last 1000 years on the Noto Peninsula,” Geophysical Research Letters (2009): emerged shorelines and earlier uplift.
- Ishiyama et al., “Structures and active tectonics of compressionally reactivated back-arc failed rift across the Toyama trough,” Tectonophysics (2017): inversion of Japan Sea rift structures.
- Regional probabilistic tsunami hazard assessment associated with active faults along the eastern margin of the Sea of Japan (2020): tsunami history and probabilistic assessment.
- Earthquake Research Committee: long-term assessment of submarine active faults in the central-southern Sea of Japan: current assessment including the Noto Peninsula North Coast Fault Zone.
Editorial note: The large deformation zone is a long-lived concentration of faults and folds, not one crack newly created in 2024. The 6–7m figure is slip along the fault plane in the preferred tsunami model; up to about 3m is the locally measured vertical seafloor uplift. There is no direct proof that the entire LDZ slipped in 2024, and the model underestimates Sado and Niigata. The tsunami contribution of submarine landslides remains unresolved. M7.6 is JMA magnitude and Mw7.5 is moment magnitude. Long-term scenario magnitudes do not predict when an earthquake will occur. The hero image is an editorial illustration, not survey evidence.