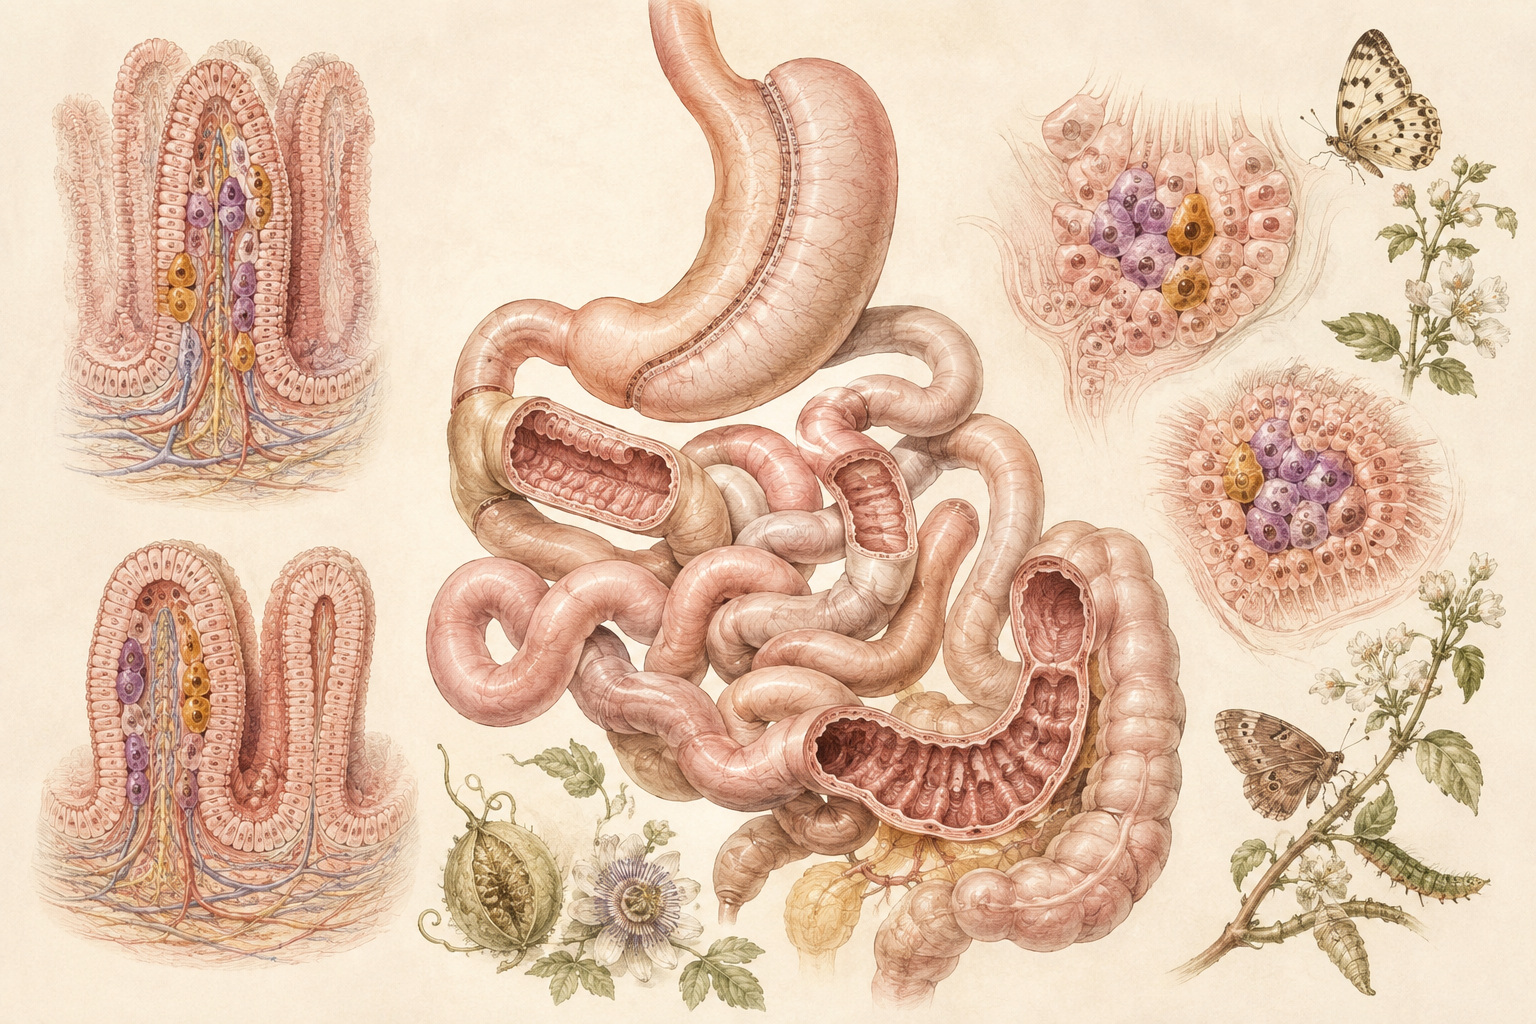
A SMALLER stomach can produce changes far beyond the stomach. Sleeve gastrectomy narrows the organ into a tube, limiting how much it can hold. Yet the operation’s metabolic effects have long suggested that restriction is only part of the story. A Kyoto University-led team has now built a three-dimensional map of what happened downstream in the intestines of male mice.
The group included Naoki Wada, a research student at Kyoto University’s Graduate School of Medicine who is now a staff physician in diabetes and endocrinology at Japanese Red Cross Osaka Hospital; Kyoto University Assistant Professor Eri Ikeguchi, now a program-specific assistant professor at Kyoto University Hospital’s Preemptive Medicine and Lifestyle Disease Research Center; Kyoto University Professor Daisuke Yabe; University of Fukui Professor Norio Harada; and Nobuya Inagaki, president of Tazuke Kofukai Medical Research Institute Kitano Hospital and a Kyoto University professor emeritus.
The paper, “An analysis of intestinal morphology and incretin-producing cells after sleeve gastrectomy in male mice,” was published online in the Journal of Molecular Endocrinology on August 20, 2026. Wada is the first author, Harada the corresponding author and Yabe the final author. The DOI is 10.1530/JME-26-0016.
Why Restriction Is Not the Whole Explanation
Obesity is closely associated with type 2 diabetes, dyslipidemia and hypertension. Treatment can include changes in diet and physical activity, medicines such as GLP-1 receptor agonists and dual GIP/GLP-1 receptor agonists, and metabolic or bariatric surgery.
Sleeve gastrectomy, often abbreviated SG, is one widely used operation. It reduces gastric capacity, but that physical restriction alone does not fully explain the improvement in glucose metabolism observed after surgery. Food can move through the gastrointestinal tract more quickly, while secretion of the gut hormone GLP-1 can rise. Findings on GIP have been less consistent, and the behavior of the K cells that make it has remained less clear.
GLP-1 and GIP are incretins: intestinal hormones released in response to food that help stimulate insulin secretion in a glucose-dependent manner. L cells produce GLP-1 in the small and large intestines; K cells produce GIP mainly in the small intestine. These naturally secreted hormones are related to, but distinct from, the receptor-agonist medicines used in clinical care.
Making the Gut Transparent
Conventional histology examines thin, two-dimensional slices of tissue. That method is essential, but a slice can make it difficult to measure complex villi and crypts across a broad field or to count sparse endocrine cells while retaining their position in three dimensions.
The team used the CUBIC tissue-clearing method to reduce the substances that scatter light in intestinal tissue. Confocal microscopy could then record fluorescent structures through the cleared samples. Three reporter-mouse lines identified intestinal epithelial cells with tdTomato, GLP-1-producing L cells with Gcg-GFP and GIP-producing K cells with GIP-GFP.
Nine-week-old male mice underwent either sleeve gastrectomy or a sham operation. In the SG group, more than half of the greater-curvature side of the stomach was removed. The researchers sampled the small intestine as S1 through S5—corresponding from duodenum through jejunum to ileum—and the colon as C1 through C3. Software quantified villus and crypt shape, cell number and cell location.
- Track body weight, food intake and intestinal transit after surgery.
- Clear representative small-intestinal and colonic regions with CUBIC.
- Visualize epithelium, L cells and K cells with fluorescent reporter mice.
- Measure villi, crypts, cell abundance and spatial distribution in three dimensions.
- Pair the tissue map with oral glucose tests, hormone measurements and gene-expression analysis.
Remodeling Was Local, Not Uniform
The clearest structural result appeared in S1, the duodenum. Villus length and the major-axis dimension were significantly shorter after sleeve gastrectomy than after the sham procedure. Villi are fingerlike projections that line the intestine and contribute to nutrient absorption.
No comparable major morphological difference appeared in S2 through S5, from jejunum to ileum. The depth and short- and long-axis measurements of intestinal crypts also showed no significant difference in the small intestine or colon. The map therefore does not describe a wholesale shrinking of the gut. It identifies a pronounced local response in the duodenum.
The sampling boundary matters. Researchers examined representative regions, not one uninterrupted three-dimensional image of the entire intestinal tract. The absence of a measured difference in the sampled fields does not prove that no other changes occurred elsewhere.
Two Incretin Cell Populations Moved in Opposite Directions
In the villi of S4 and S5, the ileal regions, the number of GLP-1-producing L cells increased significantly after surgery. Expression of the gene encoding GLP-1 was higher across the small intestine, while L-cell counts in the colon did not differ between the two groups.
The GIP result took another form. GIP-producing K cells decreased in S1, the duodenum. Yet GIP messenger RNA measured per isolated K cell in the upper small intestine increased, and the overall GIP response in the glucose test did not differ significantly between groups.
The authors propose that greater production per remaining K cell, possibly combined with stronger nutrient stimulation farther downstream, could help maintain GIP secretion despite fewer duodenal K cells. That is a mechanistic interpretation, not a causal pathway directly demonstrated by the study.
| Region or measure | What the study observed | What remains unresolved |
|---|---|---|
| Duodenal villi | Villus length and major-axis dimension were shorter in the SG group. | Whether the structural change directly contributes to metabolic improvement. |
| Ileal L cells | L-cell counts increased in S4 and S5; small-intestinal GLP-1 gene expression rose. | How much the cell increase causes the higher GLP-1 and insulin responses. |
| Duodenal K cells | K-cell counts fell in S1 while per-cell GIP messenger RNA increased upstream. | The mechanism that maintains GIP secretion with fewer duodenal K cells. |
| Colon | Colon L-cell counts did not differ significantly between groups. | Changes outside the representative fields or in other colonic cell features. |
| Translation | Normal-diet, non-obese male mice showed the mapped responses. | Whether they occur in obesity models, females, human tissue or patients. |
Faster Transit and a Different Glucose Response
The surgery group initially lost more weight, but by postoperative day 28 its body weight no longer differed from that of the sham group. Food intake showed no significant group difference. Intestinal transit, however, was faster after sleeve gastrectomy.
During an oral glucose tolerance test, both the 15-minute value and the integrated response for insulin and GLP-1 were higher in the SG group. Glucose tolerance improved. GIP values and their integrated response did not differ significantly between groups.
These results connect the three-dimensional tissue map with whole-animal physiology, but they do not assign a single cause. The experiment does not prove that shorter duodenal villi, more ileal L cells or faster transit independently produced the better glucose response. The changes may interact, and other pathways may contribute.
A Precise Map With Tight Boundaries
The study’s precision comes from combining reporter mice, tissue clearing, three-dimensional measurement and hormone testing. Its limits come from the same experimental design. The animals were young, male, non-obese and fed a normal diet. That controls biological variation, but it is not the clinical population in which the operation is commonly considered.
Obesity can alter inflammation, bile-acid signaling, gut motility and endocrine-cell behavior. Biological sex may also affect the response. Repeating the work in obesity models and female animals, followed by analysis of human tissue, will be necessary before the map can support claims about patients.
The work also does not compare surgery with GLP-1 receptor agonists, dual GIP/GLP-1 receptor agonists or other treatments. It establishes neither superiority nor equivalence and should not be used to choose a treatment.
SURGERY More than half of the stomach’s greater-curvature side is removed in the SG group.
TRANSIT Material moves through the intestine faster after the operation.
LOCAL MAP Duodenal villi shorten; ileal L cells increase; duodenal K cells decrease.
GLUCOSE TEST GLP-1 and insulin responses rise while glucose tolerance improves.
AUGUST 20, 2026 The paper is published online.
NEXT TESTS Study obesity models, females, human tissue, bile acids and transit-related signaling.
From Three-Dimensional Map to Mechanism
The next question is not simply whether the gut changes, but how its local adaptations are coordinated. Faster transit may expose distal L cells to nutrients sooner. Bile acids and other post-surgical signals may alter endocrine-cell identity or activity. The remaining K cells may compensate at the level of hormone production. Those connections still require direct testing.
The researchers plan to extend the approach to obesity models and human tissue and to investigate bile-acid signaling and intestinal transit. A continuous whole-gut map would also help determine how well the sampled regions represent the tract between them.
For now, the achievement is anatomical and functional rather than clinical. The operation did not trigger one uniform intestinal response. It generated a regional pattern: altered villi near the stomach, more GLP-1-producing cells downstream, fewer GIP-producing cells upstream and a preserved GIP response. Three-dimensional imaging turns that pattern into a testable map of post-surgical adaptation.
- Kyoto University — Japanese research news, August 28, 2026
- Kyoto University — Detailed joint Japanese research release, August 28, 2026
- Kyoto University — Official Daisuke Yabe researcher profile
- Wada et al. — “An analysis of intestinal morphology and incretin-producing cells after sleeve gastrectomy in male mice,” Journal of Molecular Endocrinology
This English report was written independently from Japanese primary university material, its detailed research release and the published paper record available through August 29, 2026. Names, affiliations, titles, the paper title, journal, DOI and specialist terms were checked against official records; English author forms follow the paper’s author list. The release supplied no direct researcher quotation, so none is presented here. The study received support including Japanese government research funding, JSPS KAKENHI grants 24K11712 and 25K11782, diabetes-related foundations and the Japan Diabetes Society Career Development Award supported by Sanofi in 2024–2025.