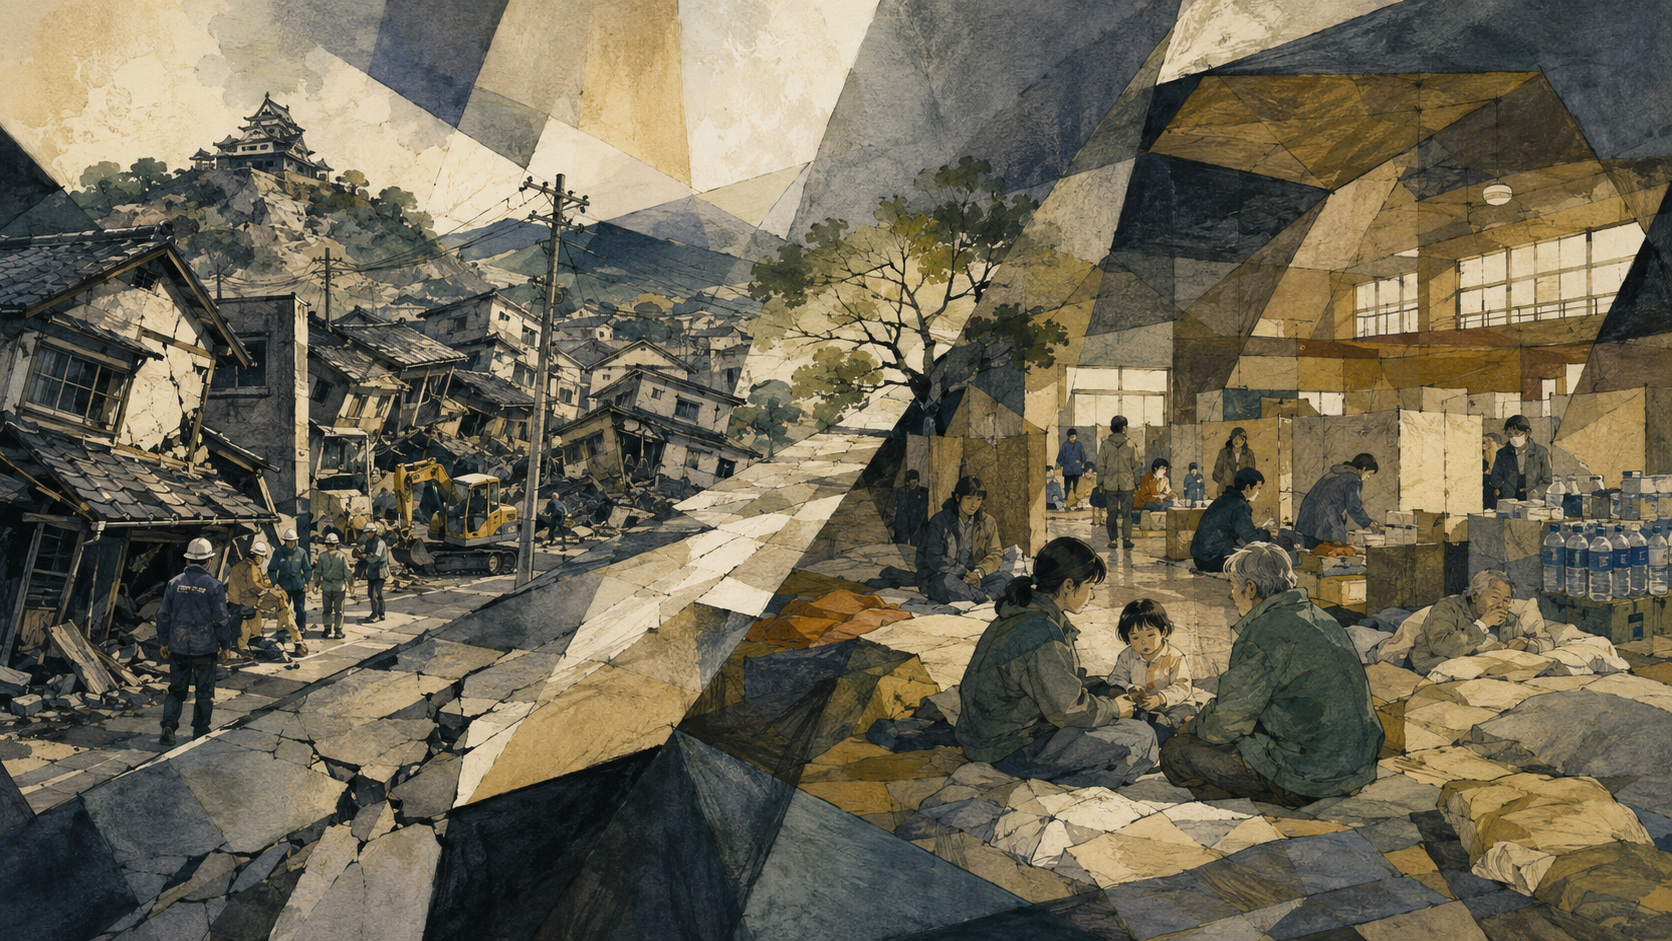
Two weeks after an earthquake, the loudest machinery is no longer always at a rescue site. It is at a broken water main, an emergency housing plot, a municipal counter issuing disaster certificates, or a school gymnasium where families have learned the nightly geography of cardboard beds, charging cables and the shortest route to the toilet.
At 4:27 PM on July 28, a magnitude 7.1 earthquake struck at a provisional depth of 16 kilometers beneath the Kumamoto region. Uki City and Hikawa Town registered intensity 7, the top of Japan’s seismic scale. The first hours were measured in alarms, collapsed walls and lives that could still be reached. By August 12, the emergency had changed shape. Kumamoto Prefecture’s 2:00 PM assessment counted 393 cases of human harm, including 39 deaths; 3,585 registered occupants in 81 open shelters across 11 municipalities; and 26,906 residential buildings reported damaged or suspected of damage.
The temptation is to read those numbers as a conclusion. They are better understood as the opening balance sheet of recovery. A death may still require a municipal panel to decide whether physical strain, interrupted treatment or deteriorating illness made it disaster-related. A house may appear in the total before an inspector determines whether it is totally destroyed, half destroyed or partly damaged. A person sleeping in a car, staying with relatives or remaining in a damaged home may need assistance without appearing in the count of people inside designated shelters.
This is why a disaster tally moves even when the earth is comparatively still. It changes as names are reconciled, injuries are classified, streets are reached, buildings are inspected and people move between shelter, hospital, hotel, rental unit and home. The August 12 document is precise about its time because the count is a process.
Thirty-Nine Deaths, but Not One Simple Category
The headline total contains three different administrative states. Municipalities had confirmed that 36 people died because of the disaster. One other person may have died after an injury worsened or an illness developed under the physical burden of the disaster; the prefecture noted that a formal determination would come through a municipal review panel. The relationship of two further deaths to the disaster remained under investigation.
This distinction is not bureaucratic hair-splitting. It determines whether the public record recognizes deaths that occur beyond the instant of structural collapse. Japanese disaster accounting separates immediate, disaster-caused deaths from deaths later certified as related to evacuation, interrupted care, physical strain or other consequences. The decision requires evidence and review because the chain of causation can be medically and legally difficult.
The same incompleteness appears in the injury count. Of 354 injured people, 26 were classed as seriously injured, meaning they required at least three weeks of inpatient treatment; 95 were moderate and 57 minor. The remaining 176—almost half of the injury total—were still awaiting classification. The official figure of 393 cases of human harm is therefore exact at the stated hour, but much of the information inside it was still maturing.
Kumamoto’s own history explains why that work matters. The latest prefectural account of the 2016 Kumamoto earthquake lists 275 deaths: 50 direct and 225 disaster-related. In other words, the later consequences ultimately accounted for more than four times as many deaths as the immediate shaking. The two earthquakes differ in rupture, season, geography and damage; their tolls should not be treated as a competition. The historical warning is narrower and more urgent: survival at the moment of impact does not end the danger.
The Second Emergency Inside the Shelter
On August 12, the problem was not only how many people remained sheltered, but what two weeks of shelter life were doing to them. Government teams were circulating through shelters and making household visits in Kumamoto, Yatsushiro, Hikawa, Uki, Uto and Misato. They were checking health and needs, distributing walking aids and fixed handrails, supporting people who needed help with daily activities, and providing information on heat illness and deep-vein thrombosis. Infection-control specialists were also dispatched after multiple COVID-19 cases were identified in some shelters.
The weather made the calendar medically significant. The August 12 national briefing warned of daytime highs around 35°C and nighttime lows around 25°C for the days ahead. Heat does not release its pressure when the sun goes down. In crowded spaces it compounds dehydration, poor sleep and the difficulty of managing chronic conditions. People who avoid drinking because toilets are distant or hard to use can increase their own risk. People who sit or lie still for long periods can lose strength or develop circulatory problems.
The Japanese term seikatsu fukatsubatsu-byo—illness associated with inactivity in daily life, often rendered as disuse syndrome—captures another threat. Ordinary movement disappears when stairs are unsafe, streets are broken, privacy is scarce and a person’s world contracts to a bed-sized rectangle. Older adults can lose muscle and independence quickly. A handrail, a cane, regular walking and a health worker’s visit are not comfort extras; they are interventions against decline.
Water service remained a major constraint. A national status report on August 11 said roughly 33,300 households in three Kumamoto municipalities were without water. Emergency supply was prioritizing shelters, medical institutions and welfare facilities. A mobile purification unit had operated since August 4 and was supplying bathing facilities from August 9. The same missing water that complicates drinking also reaches toilets, handwashing, laundry, food preparation and infection control.
Japan’s post-disaster guidance now treats toilets, food, bathing, privacy, accessibility, sleeping arrangements and support for people outside designated shelters as a connected health system. That evolution owes much to past disasters, including Kumamoto in 2016. But written lessons do not implement themselves. They require local staff, outside teams, equipment, accurate rosters and repeated visits—while the people running the system may themselves have damaged homes.
Where the Shelter Burden Fell
The prefectural total was highly concentrated. Yatsushiro City held 2,182 of the 3,585 registered shelter residents—60.9% of the total—in 37 locations. Uki had 670 residents in 11 shelters and Hikawa 289 in four. Together those three municipalities accounted for 87.6% of everyone counted in an open shelter.
| Municipality | Open shelters | Registered residents | Share of total residents |
|---|---|---|---|
| Yatsushiro City | 37 | 2,182 | 60.9% |
| Uki City | 11 | 670 | 18.7% |
| Hikawa Town | 4 | 289 | 8.1% |
| Kumamoto City | 15 | 282 | 7.9% |
| Uto City | 1 | 77 | 2.1% |
| Misato Town | 3 | 29 | 0.8% |
| Kashima / Mashiki / Mifune | 4 combined | 49 combined | 1.4% |
| Kosa / Ashikita | 6 combined | 7 combined | 0.2% |
| Total | 81 | 3,585 | 100% |
Concentration changes logistics. A city with 37 open sites must distribute meals, water, cooling, medical rounds, cleaning supplies and information across many rooms while tracking who has arrived and who has left. It must also begin consolidating facilities without separating people from schools, jobs, clinics and community networks.
The number can fall for several reasons. Some residents return home; some enter hospitals, hotels, public housing or temporary rentals; shelters can merge. A lower total is encouraging only when the destination is safe and support follows the person. Moving someone out of a gymnasium does not repair a cracked house, restore a prescription or reconnect a neighborhood.
Nor is 3,585 a census of everyone displaced. Cabinet Office guidance explicitly addresses evacuees living at home or in cars because designated-shelter rosters cannot by themselves reveal every need. The 2016 earthquake made that blind spot visible: people slept in commercial parking lots, parks, sports grounds, beside their homes and in vehicles, often because they feared another collapse or needed privacy, proximity to pets, or accommodation for disability.
Twenty-Six Thousand Homes—and a Number Still Under Construction
The housing figure is the largest number in the assessment and the easiest to misunderstand. The prefecture reported 26,906 residential buildings, including estimates, with confirmed or suspected damage. Of those, 1,252 were totally destroyed, 20 had major partial destruction, 1,032 were half destroyed and 9,005 had partial damage. The largest category—15,597 buildings—was “classification unconfirmed.”
| Housing category | Buildings | Share of reported total |
|---|---|---|
| Totally destroyed | 1,252 | 4.7% |
| Major partial destruction | 20 | 0.1% |
| Half destroyed | 1,032 | 3.8% |
| Partially damaged | 9,005 | 33.5% |
| Classification unconfirmed | 15,597 | 58.0% |
| Total | 26,906 | 100% |
“Unconfirmed” does not mean undamaged. It means the report had not yet assigned the building to a final category. Early totals may combine rapid municipal reports, estimates and later field inspections. Access can be difficult. A damaged exterior may conceal structural failure, while a dramatic fallen wall may be repairable. Liquefaction and ground settlement can tilt a house even when its roof remains intact. Repeated earthquakes can change a previously observed condition.
The unit is also important: the table counts residential buildings, not necessarily households or residents. One building can contain several homes; one household can occupy only part of a building. The count is a map of damaged structures, not a direct total of people needing accommodation.
- Emergency building-safety assessment: a rapid post-earthquake check intended to reduce secondary harm from collapse or falling objects during aftershocks.
- Residential damage assessment: a municipal determination of the degree of damage under national criteria.
- Disaster victim certificate: the document issued from that damage determination and used for many forms of public assistance.
A danger sticker from the rapid safety check does not automatically mean that the home will be certified as totally destroyed. The purposes and standards differ, although information from the safety check can assist the later assessment.
When a Damage Category Becomes a Doorway
For a resident, classification is not an abstract label. A disaster victim certificate can be required for recovery grants, condolence payments, loans, fee reductions and other support. The prefecture’s 2026 livelihood-recovery page directs applicants to attach a residence record and disaster certificate, with municipalities responsible for issuing the certificate. This converts inspection capacity into recovery speed.
It also explains why the count can rise after the shaking. Teams do not merely look for buildings that no longer stand. They document walls, foundations, tilt, settlement and component damage. Residents may request a second-stage interior inspection or reassessment. Municipalities must make decisions consistent enough to withstand review while moving quickly enough that households can act.
Emergency safety assessments had begun in Uki and Hikawa on July 29, Kumamoto City on July 30, Yatsushiro and Ashikita on August 1, and Uto, Misato and Kashima on August 2. This geography closely follows the shelter map, but the two systems answer different questions: “Can I safely enter now?” and “What degree of disaster damage has my home sustained?”
The 15,597 unclassified buildings therefore represent more than an information gap. They are thousands of unresolved decisions about repair, demolition, financial eligibility and whether returning home is possible. The unclassified share will shrink, but the totals within individual categories may rise as it does.
From a Shelter Floor to a Front Door
By the second week, the government was building several exits from mass sheltering at once. Construction began August 3 on 70 temporary homes at four sites in Uki and Hikawa, with occupancy planned for early or late September. A later national update reported another 12 units under construction in Misato, plus planned sites in Kumamoto City and Hikawa. Applications for 29 prefectural and 59 Kumamoto municipal public-housing units opened August 6. Rental-type emergency housing was accepting applications in 13 municipalities by August 10.
These are different tools for different households. An available public apartment can be fast but far from a person’s community. A leased private rental may preserve ordinary domestic life but depends on supply, accessibility and landlord participation. Constructed temporary housing takes longer, yet can be placed near affected communities and designed around local needs. Repairing a home can be the least disruptive option when the structure is safe and materials and contractors are available.
Each path has a hidden dependency: damage assessment, documents, matching, transport, utilities and follow-up. A unit is not truly available to an older resident if stairs make it inaccessible. A rental is not a solution if it separates a caregiver from the person they support. A temporary estate is not a community merely because the buildings are aligned; it needs places to meet, ways to check on isolated residents and connections to shops, schools and health care.
Kumamoto learned that in 2016. The prefecture’s official record says 183,882 people—about one-tenth of its population—were in municipal shelters at the peak, 9:30 AM on April 17. Others stayed outside the official system. The final municipal shelter did not close until November 18, seven months after the major shocks. The arc from a crowded gymnasium to permanent housing was not a single evacuation but a series of moves, each capable of weakening social ties.
July 28 · 4:27 PM M7.1 earthquake; intensity 7 in Uki and Hikawa.
July 29 Emergency building-safety assessments begin in Uki and Hikawa.
August 3 Construction starts on the first 70 temporary homes.
August 6 Applications open for 88 prefectural and Kumamoto City public-housing units.
August 7 The disaster is formally designated a “specified emergency disaster,” enabling administrative extensions and relief.
August 10 Rental-type emergency housing applications are open in 13 municipalities; livelihood-recovery support arrangements advance.
August 12 · noon JMA records 623 earthquakes of intensity 1 or greater since the main shock.
August 12 · 2:00 PM Prefecture records 39 deaths, 3,585 people in 81 shelters and 26,906 damaged or possibly damaged homes.
2016 Is a Memory, Not a Template
Ten years separates the two Kumamoto earthquakes, but memory compresses the distance. In 2016, the same region experienced intensity 7 twice within 28 hours: a magnitude 6.5 event on April 14 and a magnitude 7.3 main shock early on April 16. More than 4,400 felt earthquakes were eventually counted through April 2018. Fear of the next violent movement helped drive outdoor and vehicle evacuation.
That experience changed policy. Kumamoto and the national government strengthened attention to people outside designated shelters, vehicle sleepers, welfare shelters, accessible toilets, partitions, cardboard beds, air conditioning, health surveillance and the preservation of community ties in temporary housing. The response visible in 2026—cooling equipment, infection-control teams, support for deep-vein thrombosis prevention, individual visits and multiple housing routes—carries that institutional memory.
Yet 2016 cannot be used as a script. The 2026 earthquake arrived in midsummer rather than spring. The concentration of shelter residents was farther south, especially in Yatsushiro, Uki and Hikawa. Land subsidence and liquefaction added coastal flooding concerns around Yatsushiro during high tides. Water outages and prolonged heat shaped daily risk. Lessons survive only when they are adapted to the disaster that actually occurred.
The deepest lesson is about visibility. A gymnasium full of beds is visible. A person living alone in a damaged house, a family rotating between a car and a relative’s room, or an older adult losing mobility in a quiet corner is easier to miss. Good response therefore moves outward: from shelter rosters to household visits, from building totals to named residents, from units constructed to lives reconnected.
What the Numbers Should Do Next
At two weeks, success cannot be measured simply by whether every total declines. The number of classified damaged homes should rise before it falls, because uncertainty is being resolved. The count of identified evacuees outside shelters may rise because outreach is working. The number of people in gymnasiums should fall, but only as safe, supported alternatives open. Health visits may uncover conditions that were previously unrecorded.
The most useful questions for the next phase are therefore operational. How quickly is the block of 15,597 unclassified homes being inspected? How many shelter residents have an identified housing route? Are people in cars and damaged homes on the same support lists as people in designated facilities? Are toilets, water, cooling, medication and mobility support functioning at every site—not merely delivered to a warehouse? Can residents remain near the relationships that keep them alive?
By August 12, the seismic sequence had produced 623 earthquakes registering intensity 1 or greater. JMA said activity was declining overall but remained active, and warned that strongly shaken areas should remain alert for roughly another month from August 10 to earthquakes of intensity lower 5 or greater. Recovery workers and residents were making decisions about damaged buildings while the ground was still issuing reminders.
The official assessment freezes one hour in that unstable landscape. Thirty-nine deaths demand remembrance and careful classification. Three thousand five hundred eighty-five shelter residents require more than floorspace. Twenty-six thousand nine hundred six damaged or possibly damaged homes require inspection, certification, repair and replacement. None of the numbers is merely a statistic; each is an instruction for what government and community must do next.
Fourteen days after the ground broke, Kumamoto had passed the point when urgency could be sustained by sirens alone. The harder phase had begun: the long work of preventing a second disaster inside the first.
Reporting Notes and Principal Sources
This article centers on Kumamoto Prefecture’s official assessment at 2:00 PM JST on August 12, 2026. Figures are provisional, the residential-building total includes estimates, and later releases may revise every category. Percentages were calculated from the prefecture’s published figures and may not sum precisely because of rounding. “Shelter residents” refers to people registered in the 81 open shelters in that snapshot and is not presented as a complete count of displacement.
- Kumamoto Prefecture Disaster Response Headquarters: damage, deaths, injuries, housing and shelter status at 2:00 PM on August 12
- Cabinet Office: August 12 emergency headquarters briefing on seismic activity, weather and shelter-health support
- Cabinet Office: August 11 national damage and response status, including water supply and administrative measures
- Ministry of Land, Infrastructure, Transport and Tourism: August 10 housing response, safety assessments and temporary accommodation
- Kyushu Regional Development Bureau: temporary housing sites, public-housing availability and safety-assessment schedule
- Cabinet Office: national guidance for shelter environments and support for at-home and vehicle evacuees
- Cabinet Office: national standards and guidance for residential damage assessment
- Cabinet Office: implementation handbook distinguishing emergency safety checks from residential damage assessment
- Kumamoto Prefecture: livelihood-recovery support and disaster-certificate requirements for the 2026 earthquake
- Kumamoto Prefecture: official ten-year record of the 2016 earthquake, deaths, housing damage and evacuation