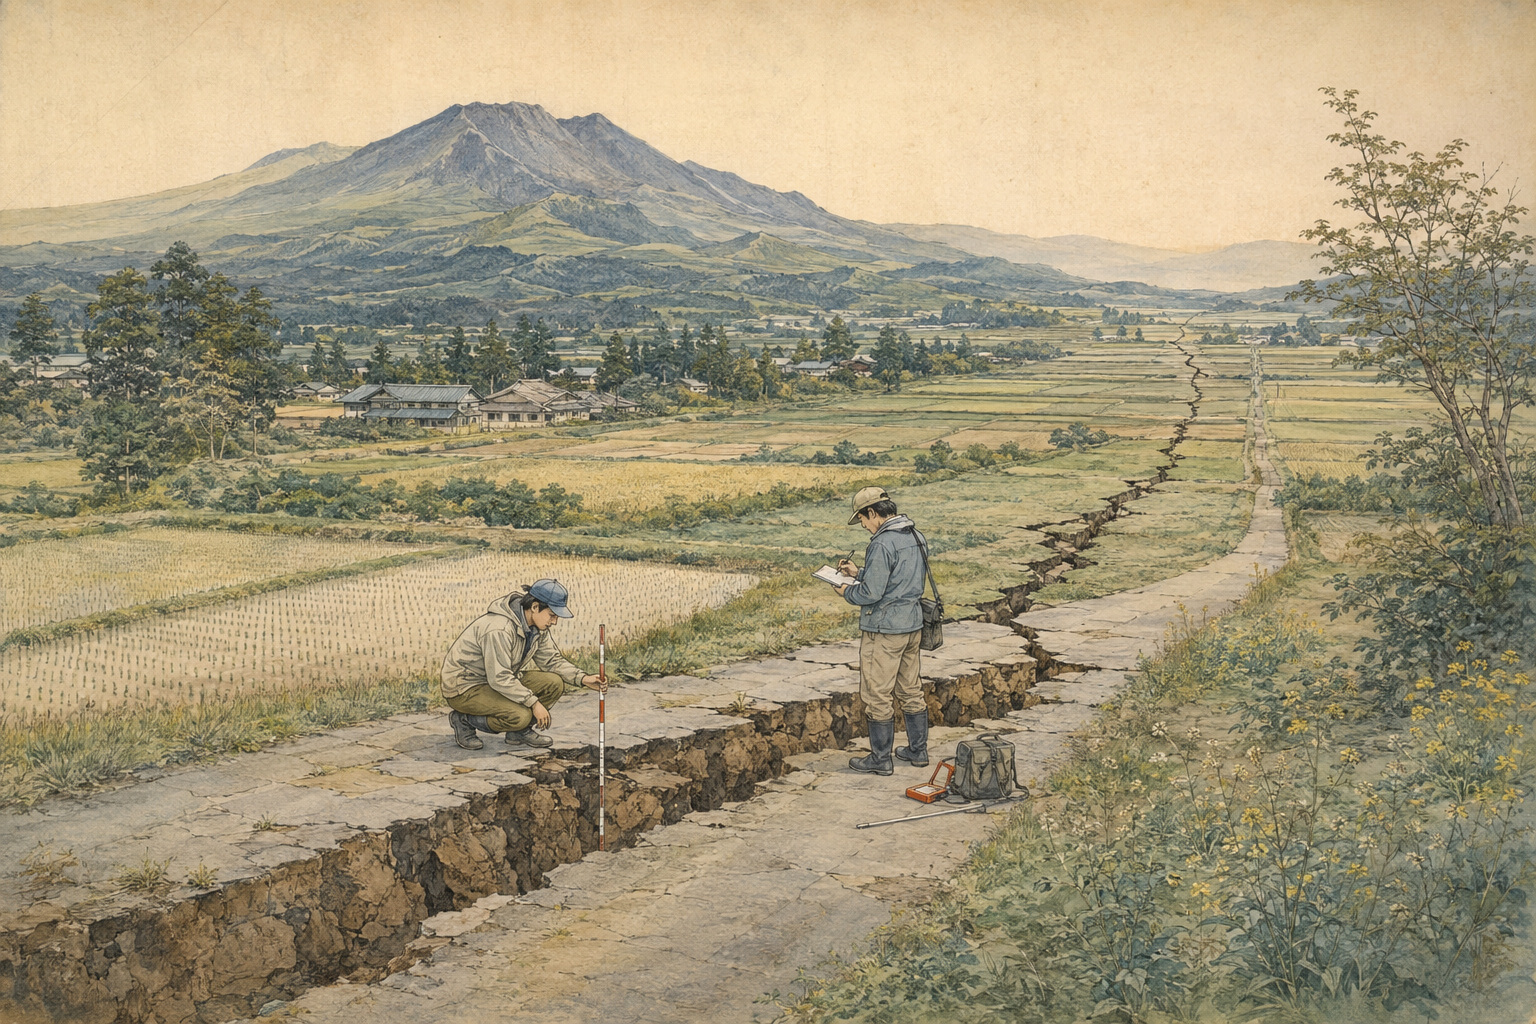
A painted line on a road reaches the place where it ought to continue—and reappears almost two meters to the side. A rice-field bank no longer meets itself. A bridge pier and the deck it supports disagree about where the ground is. At a school in Yatsushiro, cracks cross both building and playground. These are not merely photographs of damage. To an earthquake geologist, they are measurements made by the earth.
A joint team including researchers from Tohoku University and Kumamoto University said on August 6 that it had confirmed ground-surface displacement along a roughly straight 33-kilometer line from Mifune to Yatsushiro. The trace broadly follows the mapped Hinagu fault zone. In the belt from Uki’s Ogawa district into Hikawa, horizontal displacement reached about 1.8 meters. Near Yatsushiro Junction, the largest reported vertical offset was about 1.5 meters.
Those numbers turn an invisible event at depth into something graspable. At 4:27 p.m. on July 28, the Japan Meteorological Agency’s magnitude 7.1 earthquake began 16 kilometers beneath Kumamoto. Uki and Hikawa recorded the maximum Japanese seismic intensity of 7. The motion was strike-slip: two sides of a steep fault moved mostly sideways, with a vertical component. The rupture propagated through rock in seconds. Days later, researchers were still walking, driving and flying its surface expression one displaced curb and field boundary at a time.
Why one earthquake has a 33-, 37- and 38-kilometer scar
The headline number is real, but it is not the only defensible number. The 33 kilometers reported by the university team is a straight-line measurement between its confirmed northern and southern limits. A rapid AIST and Japan Society of Civil Engineers survey described an endpoint-to-endpoint length of about 37 kilometers. A preliminary Association of Japanese Geographers map extended about 38 kilometers, from Togawa in Mashiki to Hirayama-shinmachi in Yatsushiro.
This is not three groups disagreeing about whether a rupture exists. They are measuring related but different things while evidence is still arriving. One map may include a northern strand with modest displacement; another may stop where a continuous tectonic pattern becomes uncertain. One value is the straight-line distance between endpoints; another follows a bending trace. Secondary breaks may be included or excluded. A gap in visible cracking does not prove that the source fault stopped below it.
Surface rupture is rarely the cinematic trench that the phrase “the ground split open” suggests. It can be a zone tens or hundreds of meters wide, with short steps, pressure ridges, hairline cracks and parallel strands. In soft ground the movement may be distributed; under pavement it can concentrate. Repairs, vegetation, standing water and earthquake-triggered settlement can obscure it. The scientifically honest map therefore has solid lines, dashed lines and question marks.
A fault, a source fault and a crack are not the same thing
An active fault is a long-lived geological structure with evidence of repeated movement in the recent geological past and the potential to move again. A source fault is the surface at depth that slipped during this earthquake and radiated seismic waves. A surface earthquake fault is the rupture or deformation produced where that movement reaches the ground.
Not every fresh crack belongs in the third category. Shaking can settle artificial fill, spread a riverbank laterally, liquefy saturated sand, topple a retaining wall or pull a landslide downslope. Investigators look for a coherent line, a consistent direction of displacement, continuation across different landforms and agreement with satellite deformation, aftershock locations and known active-fault geometry. A crack beside one damaged drain may be local failure. The same right-lateral offset repeated across roads, field ridges and canals for kilometers is geological evidence.
“Right-lateral” can be read without specialist language. Stand on either side of the fault and look across: the land opposite has moved to your right. The 2026 rupture also has a vertical component. AIST’s rapid field team measured, among other examples, about 43 centimeters of right-lateral motion and 39 centimeters of northwest-side-down motion at Shimo-go in Uki; 98 centimeters of horizontal movement at Shabajintoge; 115 centimeters horizontally at Ono in Hikawa; and 184 centimeters at Miyahara. The pattern varied from place to place because the fault is not a machined plane.
- Field measurement: tape, survey instruments, drones and photographs document offset roads, drains, levees, walls and natural landforms.
- SAR satellites: radar images before and after the quake reveal broad ground movement even through cloud and at night.
- GNSS: permanent stations record how far points on the crust moved, helping model the source fault at depth.
- Seismology: waveforms and aftershock locations constrain the fault’s orientation, mechanism and active area.
The satellite saw a landscape move, not just a line crack
Japan’s Geospatial Information Authority used ALOS-2 and ALOS-4 radar data to map deformation around the Hinagu fault. Its two-and-a-half-dimensional analysis found as much as roughly one meter of eastward movement and about 50 centimeters of subsidence northwest of the fault. Close to the rupture the deformation was too complex for a single precise satellite value—a caution that matters when vivid colored interferograms are mistaken for photographs.
Satellite radar measures change along the sensor’s line of sight. It is exceptionally good at seeing a broad, coherent displacement field, but it does not replace a geologist kneeling beside a curb. Fieldwork identifies which break is tectonic and measures its components. The satellite connects those local observations across the landscape. GNSS adds fixed points, while the JMA’s waveforms show the faulting was a shallow crustal strike-slip event.
The agencies’ magnitudes also need translation. The JMA reported magnitude 7.1 on its scale; the U.S. Geological Survey reported moment magnitude 6.8. Magnitude scales are calculated from different observations and calibrated differently, so the two figures do not mean one agency found a smaller earthquake. Intensity is different again: it describes shaking at a place. JMA intensity 7 in Uki and Hikawa says what the ground did there, not the event’s total size.
Ten years earlier, another 31–33 kilometers
Kumamoto had seen this form of evidence only a decade before. On April 14, 2016, a magnitude 6.5 earthquake produced intensity 7 in Mashiki. About 28 hours later, a magnitude 7.3 event struck; Mashiki and Nishihara recorded intensity 7. It was the first sequence in the JMA record to produce the maximum intensity twice. What had initially looked like the largest event became, in retrospect, the earlier member of a larger sequence—one reason seismologists avoid promising that the biggest shock is over.
The 2016 earthquakes ruptured the northern Hinagu and Futagawa fault system. A later government synthesis mapped the principal surface-fault zone over about 31–33 kilometers and a width of two to three kilometers, with maximum right-lateral displacement around 2.5 meters, roughly two meters of uplift and many secondary faults. The numerical echo is striking: 31–33 kilometers then, 33 kilometers now.
But the matching number should not conceal different geography. The dominant 2016 rupture ran northeast through Mashiki, Nishihara and toward Aso, mainly on the Futagawa section, with about six kilometers of rupture on the northern Hinagu section. The 2026 mapping extends south from Mifune through Uki and Hikawa toward Yatsushiro, chiefly along the Hinagu zone. Shinji Toda of Tohoku University noted that more residential development and major transport infrastructure now lie along the mapped displacement, so even newer buildings suffered tilting or other direct-deformation damage.
| Earthquake | Surface record | What it teaches |
|---|---|---|
| 2026 Kumamoto JMA M7.1, intensity 7 | About 33 km by one straight-line survey; about 37–38 km under broader preliminary mapping. Up to about 1.8 m horizontal displacement reported. | A known active-fault corridor had become more urbanized; direct ground displacement cut across buildings and transport structures. |
| 2016 Kumamoto sequence M6.5 then M7.3, intensity 7 twice | Principal surface-fault zone about 31–33 km, mainly Futagawa plus northern Hinagu; maximum right-lateral displacement about 2.5 m in the later synthesis. | A large first shock can be followed by a larger one, and multiple connected fault sections can participate in one sequence. |
| 1889 Kumamoto M6.3 | No comparable modern instrumental map; official historical summaries record 19 deaths and 234 houses completely destroyed. | The July 28 calendar coincidence is memorable, not predictive. The crust keeps no human anniversary. |
| 744 Higo earthquake | Historical accounts and seabed studies suggest—but do not prove—a possible event on the Yatsushiro Sea section. | Written chronicles, sediment cores and fault geometry can extend the record beyond instruments, with uncertainty stated openly. |
The date July 28 appeared once before
On July 28, 1889, a magnitude 6.3 earthquake struck the Kumamoto area. Modern JMA summaries, drawing on Japan’s catalog of damaging earthquakes, record 19 deaths and 234 houses completely destroyed. The 2026 earthquake arrived exactly 137 years later on the same month and day.
That coincidence is powerful enough to tempt meaning from a calendar. There is none. Fault stress is not synchronized to dates, seasons or anniversaries. The value of remembering 1889 is not to imply a cycle of 137 years; it is to recover a disaster that can otherwise disappear behind 2016. Instrumental records are short compared with faults whose large movements recur over thousands of years.
The archive reaches further back, but becomes less certain. The government’s long-term evaluation says the latest event on the Yatsushiro Sea section may have occurred between about 1,700 and 900 years ago and could correspond to the Higo earthquake of 744, recorded in the Shoku Nihongi. Offshore acoustic surveys and cores identify ancient seabed displacement consistent with an event in that broad interval. “Could correspond” is the crucial phrase: a historical account and a geological layer can be plausibly connected without becoming eyewitness proof of one named fault.
The difficult phrase: “the part that did not break”
Rapid surveys found that the 2026 surface rupture diminished southward and that clear displacement was not confirmed along parts of the mapped trace around Higo-Koda and Hinagu Onsen. Researchers have therefore drawn attention to the farther-south Hinagu and Yatsushiro Sea sections. In everyday language this becomes “an unbroken fault remains.” That is useful for preparedness and dangerous when converted into a countdown.
Before the 2026 earthquake, the national long-term evaluation placed the 30-year probability for a roughly magnitude 7.5 earthquake on the Hinagu section at nearly zero to 6 percent. For the Yatsushiro Sea section, capable of about magnitude 7.3, it was nearly zero to 16 percent. The latter was in the government’s highest relative S rank. Those ranges reflect uncertain recurrence intervals measured in millennia. They were not a forecast for July 28, and they are not automatically the correct post-earthquake probabilities.
One rupture changes stress around neighboring fault patches, sometimes increasing it and sometimes reducing it. Calculating that transfer requires a source model, the orientation of the receiving fault and assumptions about friction. Even a well-estimated stress increase does not supply a date. The formal long-term evaluation will need to absorb the final 2026 rupture map, paleoseismic evidence and refined models before probabilities are revised.
Why a building code cannot solve two meters of missing alignment
Earthquake-resistant design primarily helps a structure survive shaking: acceleration, repeated reversals and the forces they impose. Surface faulting adds another problem. If one side of a foundation moves a meter or more sideways while the other does not, the ground has changed the building’s geometry. A stiff structure may crack; a flexible pipeline may stretch, buckle or separate; rails, canals and bridge bearings lose alignment.
This does not make seismic engineering futile. Most damage over a broad region is caused by shaking, ground failure and fire, and modern design saves lives. Nor does every building beside a fault collapse. Studies of 2016 found both severe damage concentrated very near the mapped rupture and striking examples of structures that survived beside it. Foundation type, building age, soil, rupture distribution and the direction of motion all matter.
But the narrow corridor of direct deformation calls for tools beyond stronger beams: detailed active-fault maps; route redundancy; shutoff valves; flexible or replaceable joints in water, gas and communications lines; bridge bearings that can be inspected and changed; and land-use decisions that avoid placing the most critical facilities directly across the best-established traces. The location uncertainty must be shown as a zone, not a perfect hairline on a map.
The 2026 rupture crossed a landscape more densely built than parts of the 2016 corridor. That makes each damaged curb and school wall evidence for engineering, not only geology. Did a foundation bridge the displacement or follow it? Which pipe joints retained service? How did older canal repairs behave? The answers will shape reconstruction long after the fault itself is paved over.
A scar can be preserved without turning suffering into spectacle
After 2016, Kumamoto chose to preserve parts of its broken ground. At the former Tokai University Aso campus, the old Building No. 1 and a surface fault are maintained together as a disaster memorial beside the KIOKU exhibition center. Visitors can see that a fault is neither an abstract red line nor a monster’s crack; it is a place where a lawn, a path and a structure no longer line up.
The new rupture will force similar decisions. Most breaks through farms, roads and homes must be repaired quickly. Owners need privacy and access, not crowds. Yet if every trace disappears before it is measured, photographed and sampled, an irreplaceable scientific record is lost. Preservation can mean a protected short section, a three-dimensional scan, an archived drone model or a marker built into the restored landscape—not leaving an entire community wounded for display.
The field map also belongs to residents. It can explain why one house tilted while another block mainly shook, why a canal stopped delivering water, or why an expressway structure failed at a precise point. Evidence does not erase loss, but it gives recovery a cause more exact than “the earthquake did it.”
What the 33-kilometer line asks of Kumamoto
As of noon August 7, the JMA had counted 563 earthquakes of intensity 1 or greater in the activity area, including the main shock. The number was declining unevenly, but activity remained high. At the same time Typhoon Dolphin brought rain and wind toward a prefecture with damaged roofs, cracked slopes and thousands of displaced residents. Mapping the fault was urgent science conducted inside an unfinished emergency.
The final rupture atlas will take months or years. Survey teams will reconcile GPS coordinates, remove shaking-induced cracks, add faint traces visible in radar or elevation data, and compare the 2026 offsets with trench records of prehistoric earthquakes. The neat 33-kilometer line of the first report will become a branching, qualified geological document.
Its central fact will remain. On July 28, a buried fault reached the lived surface of Kumamoto. It moved highways designed for motion, fields shaped by generations, and buildings raised after the lessons of 2016. The line is a record of failure—but also a design brief. It shows where measurement, memory and rebuilding must meet.
744 A damaging earthquake is recorded in Higo; seabed evidence may correspond to movement on the Yatsushiro Sea section, but the identification is uncertain.
July 28, 1889 An M6.3 Kumamoto earthquake kills 19 people and completely destroys 234 houses in later official summaries.
April 14–16, 2016 M6.5 and M7.3 earthquakes produce intensity 7 twice and a principal 31–33 km surface-fault zone.
July 28, 2026, 4:27 p.m. The M7.1 Kumamoto earthquake strikes at a depth of 16 km; Uki and Hikawa record intensity 7.
July 30–August 3 AIST and partner teams measure right-lateral and vertical displacement from Mifune toward Yatsushiro.
August 6 The Tohoku–Kumamoto team announces a roughly 33 km straight-line surface rupture with horizontal displacement up to about 1.8 m.
August 7 Other rapid surveys describe endpoint or mapped lengths near 37–38 km; JMA reports 563 felt events through noon.
Reporting note and principal sources
This article uses public information available through August 8, 2026, 6:00 a.m. JST. Rupture lengths, endpoints, displacement and damage figures are preliminary. The 33-, 37- and 38-kilometer values use different survey definitions and should not be treated as final competing measurements.
- The Mainichi: university team’s 33-kilometer finding
- Japan Meteorological Agency: 2026 Kumamoto Earthquake portal
- JMA: activity and safety summary through August 7
- Earthquake Research Committee: evaluation of the 2026 Kumamoto earthquake
- Geospatial Information Authority: ALOS-2/ALOS-4 crustal deformation
- Geospatial Information Authority: provisional source-fault model
- AIST Geological Survey of Japan: fifth rapid field survey
- Japan Society of Civil Engineers/AIST: August 6 surface-fault briefing
- Association of Japanese Geographers: preliminary surface-fault distribution
- Fire and Disaster Management Agency: August 7 damage summary
- Earthquake Research Committee: Futagawa and Hinagu fault long-term evaluation
- Government comprehensive survey: 2016 surface-fault synthesis
- AIST Geological Survey of Japan: 2016 emergency survey
- JMA Kumamoto Local Meteorological Office: 2016 sequence overview
- JMA historical summary including the 1889 earthquake
- Earthquake Research Committee: regional fault history, including the possible 744 event
- Japan Society of Civil Engineers: damage near 2016 surface faults
- Kumamoto Prefecture: KIOKU and preserved 2016 earthquake remains
- U.S. Geological Survey: 2026 event page and moment magnitude