On January 28, 2025, an intersection in Yashio, Saitama Prefecture, opened into the earth. A truck fell into the collapse, which was believed to have been caused by a damaged regional sewer pipe. As rescue and emergency work proceeded, about 1.2 million people were at one point asked to curtail sewer use, including laundry and bathing. The enormous hole made visible, for a moment, the invisible age of Japan’s water infrastructure.
Almost 18 months later, the Cabinet approved the 2026 Water Cycle White Paper on July 10. Its special feature bears the title “The Water Cycle and Risk: Protecting People’s Lives and the Future.” The first section examines climate change and drought. The second addresses aging infrastructure, earthquakes and accidents. The third turns to digital technology, workers and cooperation among government, companies and residents.
The danger it describes is not a simple absence of water. It is the convergence of several trends: rainfall becoming more erratic, buried assets becoming older, earthquakes testing long networks, and the workforce and revenue available to operate them becoming smaller. A tap can run dry even when water exists—if it is in the wrong season, in another basin, behind a failed plant or on the far side of a broken pipe.
Turn a faucet and the river disappears from view. Flush a toilet and wastewater appears to vanish. Behind those gestures are reservoirs, aqueducts crossing watersheds, groundwater, irrigation systems, treatment plants, pumps, chemicals, electricity, telemetry and expert judgment. Nature supplies water. The promise that clean water will arrive at any hour and be treated after use is a manufactured public service, built over centuries.
How can a rainy country run short of water?
Japan is rainy enough to earn its reputation as a land of water. Annual precipitation is about 1,697 millimeters, roughly 1.4 times the global land average of about 1,171 millimeters. About 660 billion cubic meters fall over the country in a year. Roughly 35 percent is lost through evaporation and transpiration, leaving a theoretical renewable water endowment of about 430 billion cubic meters.
Divide by land and population, however, and the picture changes. Japan receives about 5,000 cubic meters of precipitation per person per year, only around one-quarter of the world average of 20,000 cubic meters. About 70 percent of the archipelago is mountainous. Rivers are short and steep. Much rain is concentrated in the rainy and typhoon seasons, so torrents can reach the sea before the water can be stored. When rain stops, flows can fall quickly.
Population concentration sharpens that mismatch. The Kanto region has about 26 percent of the national average renewable water endowment per person. Tokyo’s water security is therefore not a gift of local rainfall. It is a highly managed relationship with the Tone and Tama river systems, mountain snow, distant reservoirs, power supplies and communities upstream.
Annual abundance and daily availability are different things. Reservoirs move water through time. Aqueducts move it through space. Forests, fields and aquifers slow its passage. Distribution networks preserve pressure for the final meters. Japan’s modern water service is an engineering correction to the volatility of its climate.
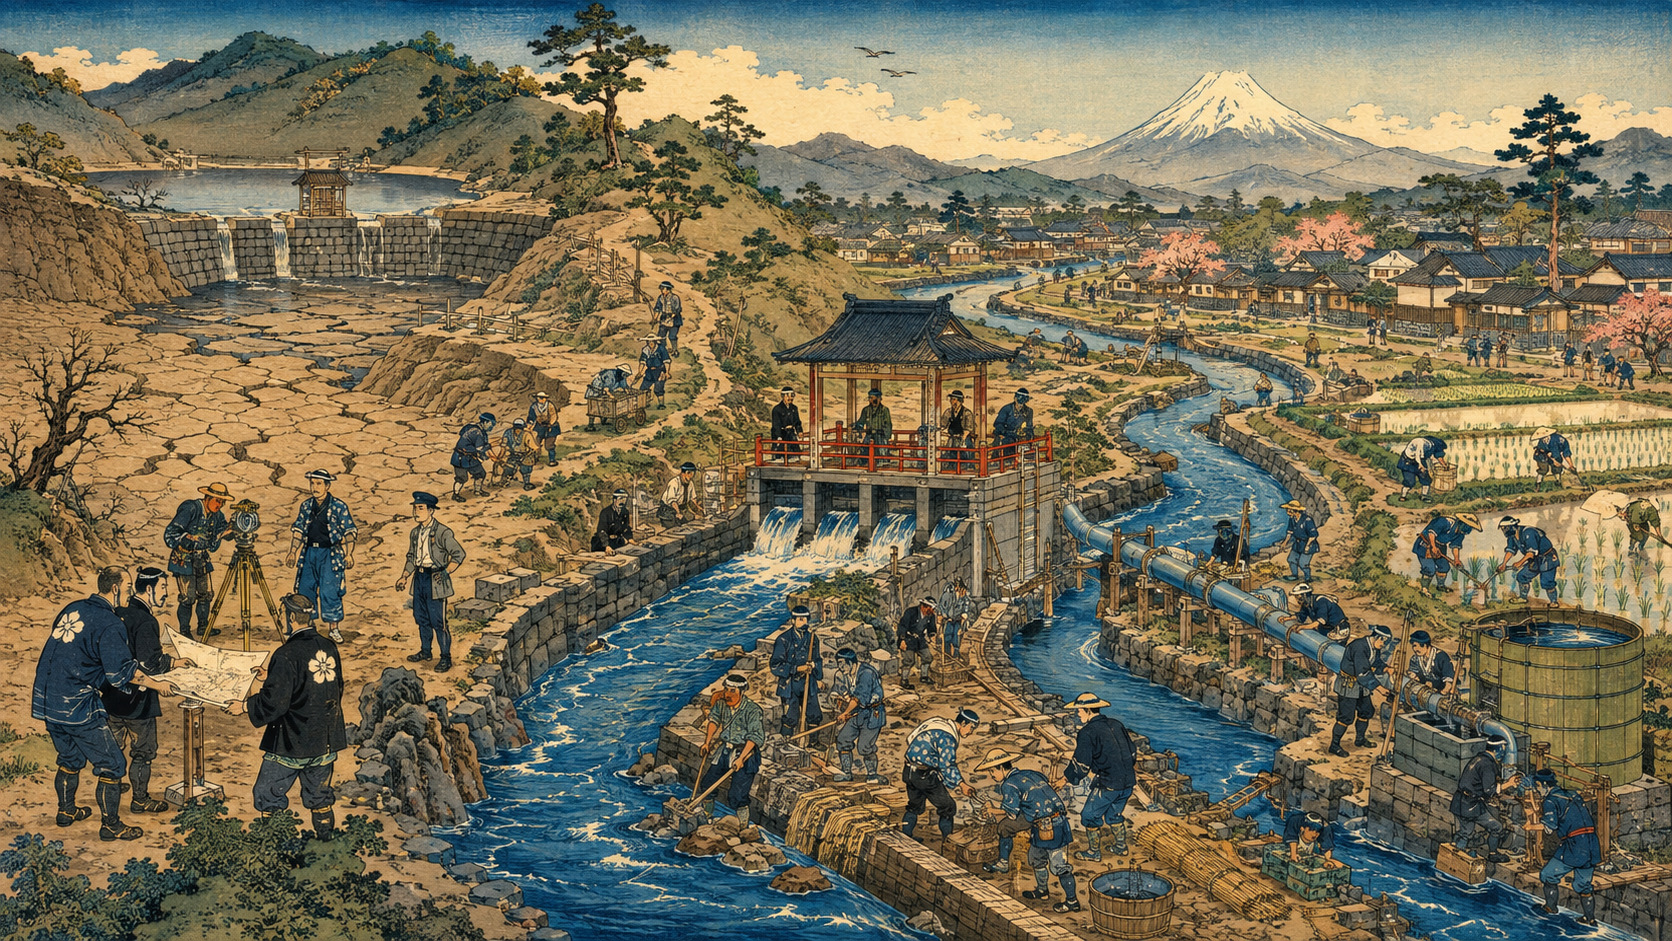
Edo moved water with gravity
The argument between Japanese cities and water is centuries old. Wells in Edo’s coastal lowlands and reclaimed ground did not reliably yield good fresh water. When Tokugawa Ieyasu entered Edo in 1590, securing an urban supply became part of building the city itself. The precise date of the Kanda waterworks is debated, but records indicate that it existed by the early 17th century.
As the population grew, the shogunate planned a much larger conduit from the Tama River in 1652. Brothers Shōemon and Seiemon began work the following year. The channel from Hamura to Yotsuya-Ōkido ran about 43 kilometers and is said to have been dug in only eight months. Its total drop was about 92 meters. With no pumps or electricity, its builders read a faint gradient and made gravity do the work.
In the city, stone and wooden conduits carried the water to communal wells. The Tamagawa Aqueduct was not merely a drinking-water line. Its branches served farms and settlements, joining the city to its hinterland. “Basin management” is a contemporary term, but the central fact is old: water quantity, quality, land, upstream users and downstream users cannot be managed independently for long.
In 1887, clean water made the modern city possible
Yokohama grew rapidly after the port opened, but many wells in the coastal and reclaimed city were brackish. Under the design and supervision of British engineer Henry Spencer Palmer, a system took water near the confluence of the Sagami and Dōshi rivers, filtered it and carried it under pressure through iron pipes. Service began on October 17, 1887—the first modern waterworks in Japan.
This was more than the arrival of a convenient tap. A protected source, filtration and a pressurized network supported disease control, firefighting and dense urban life. The Waterworks Ordinance followed in 1890, and modern systems spread through Tokyo, Osaka, Kobe and other cities. Water quality was no longer left to the fortune of each household well. It became a public responsibility.
After World War II, the country’s high-growth era produced a different challenge. Urban population, household consumption and industrial demand surged. Combined domestic and industrial water use roughly tripled between the mid-1960s and around 2000. Japan built reservoirs, weirs, purification works, sewers and vast pipe networks in concentrated waves. Today’s near-universal service is the dividend from that investment. Today’s aging problem is the bill arriving as the same generation of assets reaches renewal age together.
1964: The “Tokyo Desert” meets the Olympics
A dry period beginning in the autumn of 1961 tightened around a rapidly growing capital. During the 1964 drought, Tokyo endured 84 days of intake restrictions, reaching a maximum of 50 percent. Residents filled bathtubs and buckets during limited supply hours. The phrase “Tokyo Desert” captured the humiliation: in the year that Japan intended to display a modern capital to the world, its most basic urban service was at the edge.
The crisis accelerated Tokyo’s turn toward the Tone River. The Tone diversion weir takes water into the 14.5-kilometer Musashi Canal, which delivers it to the Arakawa. From there, the water travels to treatment plants serving Tokyo and Saitama. Emergency flow began in March 1965, and the canal was completed in 1967. Rivers that were separate on the map became one metropolitan water system.
The achievement was immense. Tokyo’s tap became supported not just by the Tama but by rain and snow far upstream in the Tone basin, by dams and by the cooperation of rural communities. Yet security also enlarged dependence. A poor snow season, simultaneous reservoir depletion or failure in a long conveyance chain can become a problem for millions. A large network is resilient because it can share water; it is fragile if its critical connections are not understood and protected.
Fukuoka turned 287 days of restriction into a water-saving city
In 1978, Fukuoka City endured water restrictions for 287 days. At the worst point, water was cut for as much as 19 hours a day. Water trucks made 13,433 trips, and valve operations required 32,434 worker deployments. Some neighborhoods did not receive water even during nominal supply hours. Residents lined up with buckets.
Fukuoka converted memory into infrastructure. Beginning in 1981, it introduced a centralized distribution-control system that monitors flow and pressure around the clock. Operators could reduce leakage, identify abnormalities quickly and redirect water through another route. The city developed reclaimed-water supplies for toilets and landscaping, diversified its sources with Chikugo River water and reservoirs, and made conservation part of civic culture.
In 1994, Fukuoka faced even lower annual rainfall. Restrictions lasted 295 days—longer than in 1978. Yet no water trucks were dispatched. The drought did not disappear, and life was still constrained. What changed was the translation from natural shortage to social harm. Diversified sources, computer-controlled distribution and practiced public behavior prevented the same hazard from producing the same disaster.
| Fukuoka drought | FY1978 | FY1994 |
|---|---|---|
| Restriction days | 287 | 295 |
| Average daily cutoff | 14 hours | 8 hours |
| Valve-operation staffing | 32,434 deployments | 14,157 deployments |
| Water trucks | 13,433 trips | 0 |
| Institutional legacy | Shift toward a water-saving city | Proof of diversified supply and distribution control |
In fiscal 2025, drought ran from summer into winter
Japan again confronted shortage on a national scale in the summer of 2025. On July 30, the Ministry of Land, Infrastructure, Transport and Tourism established its drought countermeasures headquarters for the first time in eight years. Six regional bureaus also formed headquarters. Officials watched reservoirs and rivers from the Tone to the Kizu and Yoshino systems and coordinated withdrawals for households, farms and industry.
At the Takayama and Shōrenji dams on the Kizu River, combined storage fell below the 50 percent coordination threshold in September. Water and agricultural intake was cut by 10 percent. Because the users had multiple sources, officials said the measure did not immediately affect households. That distinction is important: an intake restriction can be evidence that a preparedness system is working before shortage reaches the tap.
This is why the 2026 white paper emphasizes drought-response timelines. A timeline decides in advance who meets at each storage threshold, who requests conservation, what uses are adjusted, and when alternative sources are activated. Ten more river systems published timelines during fiscal 2025, taking the cumulative total to 42.
Nor did the problem end with summer. From December 2025 into July 2026, winter drought prompted five regional bureaus—Kanto, Chubu, Kinki, Shikoku and Kyushu—to establish response headquarters. Coordination extended across Lake Biwa and the Kino, Toyo, Niyodo and Chikugo river systems, among others. On January 29, 2026, storage at Ōdo Dam on the Niyodo system reached zero and emergency intake began. The national drought information office was not closed until July 13.
At the same time, heavy rain is intensifying. Japan’s summer of 2025 was the hottest since national records began in 1898, and the rainy season ended exceptionally early in many areas. Then, in August, a front brought destructive rainfall from western to northern Japan. The water-cycle crisis is not a choice between drying and flooding. A single year—and a single basin—can experience both.
The second drought: water exists, but the network cannot deliver it
A full reservoir is no guarantee of service if the pipe breaks. Waterworks coverage reached 98.2 percent at the end of fiscal 2023, but much of the system was built during the 1970s. At the end of fiscal 2024, 44.6 percent of trunk pipelines had seismic conformity. The seismic retrofit rates were 46.7 percent for purification facilities and 65.9 percent for distribution reservoirs. Progress continues, but more than half of the most important pipe routes remain outside the conforming share.
The 2024 Noto Peninsula earthquake cut water to roughly 136,000 households. Excluding areas where collapsed buildings and other conditions prevented restoration, the maximum outage lasted about five months. A treatment plant can survive while the system fails somewhere along intake, conveyance, transmission or distribution. Broken roads keep repair crews out. Power and telecommunications failures can disable pumping and remote control.
That is why resilience requires more than retrofitting each asset. The revised national water-cycle plan stresses substitution and multiplicity: interconnections, alternative routes, emergency generators, backup supply, wells and rainwater. A chain is not protected by the average strength of its links; it is protected by keeping the service alive when one link disappears.
Sewer risk is even less visible. Yashio showed how one large-diameter pipe can connect rescue operations, river quality, transport, businesses and the daily routines of 1.2 million people. The national government requested special priority inspections and tightened information-sharing between road managers and the owners of buried infrastructure. Listing pipes by age is not enough. Diameter, corrosion, traffic loading, downstream consequences and the absence of a bypass must be combined to identify where a failure would do the most harm.
- Age: An accounting life is useful for planning; it is not a predicted failure date.
- Condition: Material, corrosion, soil, joints, pressure, construction and inspection history alter risk.
- Consequence: Hospitals, shelters, trunk mains and plants make some interruptions more damaging.
- Redundancy: A line with a viable alternative route is stronger than a similar line with none.
Climate change does not simply “reduce rain”
The Ministry of Education and the Japan Meteorological Agency’s Climate Change in Japan 2025 report projects that extreme rain will become both more frequent and more intense. A downpour that occurred once per century in the preindustrial climate is projected to occur about 2.8 times per century in a world 2 degrees Celsius warmer, and about 5.3 times in a world 4 degrees warmer. The amount in a once-per-century event would rise by roughly 17 percent and 32 percent, respectively, as national averages.
More extreme rain does not make storage easy. Water concentrated in a few hours consumes flood-control capacity, creates turbidity and can rush to sea before infiltrating. Warming raises evapotranspiration. Snowpack acts as a natural reservoir; less snow and earlier melt weaken its ability to release water gradually into spring and summer. If long dry spells and intense downpours both grow, annual precipitation tells less and less about usable supply.
Many Japanese dams were designed around a low-flow reference year selected from 1956 to 1975. Climate change questions the assumption that the historical sequence of rain and snow will remain a dependable guide. The same reservoir must increasingly reconcile two opposed instructions: release or reserve capacity before a flood, and conserve water against a drought.
In 2014, Japan began returning water policy to the basin
Japanese water administration has long divided rivers, irrigation, drinking water, sewerage, groundwater, forests and the environment among different statutes and institutions. Specialization is necessary, but water does not respect an organizational chart. Forests and farms upstream, paved cities, groundwater pumping, sewage treatment and estuarine ecosystems belong to one cycle.
The Water Cycle Basic Act was enacted in 2014, followed by the first Basic Plan on Water Cycle Policy in 2015. Article 12 requires the government to report annually to the Diet on the measures it has taken. The first Water Cycle White Paper appeared in 2016. It is not simply an environmental yearbook; it is a mechanism for explaining policies dispersed across ministries as one cycle.
After the January 2024 Noto earthquake, the transfer of waterworks administration to the infrastructure and environment ministries, and increasingly visible climate impacts, the basic plan was revised about a year earlier than originally expected, in August 2024. Its priorities include stable supply through alternatives and redundancy, integrated reconstruction of water and sewerage, decarbonization, and comprehensive basin water management.
The 2026 white paper reports 85 recognized basin water-cycle plans. That is progress, not a completed national map. Rivers cross municipal boundaries; water-supply territories do not match sewer catchments, irrigation districts or aquifers. The plans should be judged less by their number than by whether they decide who yields water during drought, where stormwater is stored, and which data are shared after an accident.
Groundwater, rain and reclaimed water: the reserve below the map
During the Noto earthquake, wells and rainwater provided non-drinking water while residents waited for piped service. Groundwater can be a vital emergency reserve, but unlimited pumping can cause subsidence, salt intrusion and the loss of springs. It becomes preparedness only when quantity and quality are known in advance, emergency wells and owners are identified, delivery is organized and pumps can run during an outage.
Rainwater storage, “paddy field dams,” forests and wetlands can slow floods and support groundwater recharge. Reclaimed wastewater can replace drinking-quality water for toilets and landscaping. As Fukuoka learned, resilience is not only a matter of increasing gross supply. It also means matching water quality to use.
Nature-based systems are not free substitutes. Forest maintenance, wetland land, water-quality testing and separate reclaimed-water pipes require money and governance. Green and gray infrastructure should not be staged as rivals. They should be designed to cover one another’s weaknesses.
The shrinking-population renewal paradox
Domestic water demand peaked around the late 1990s and has gradually declined. Conservation is good, but most municipal water systems depend on user charges for operations and renewal. As population and consumption fall, revenue shrinks. The inherited network, however, does not immediately become shorter. In mountain communities and on islands, a small number of customers may still require long pipes, treatment works and skilled staff.
If the paradox is answered only with higher charges, residents of sparse areas bear the heaviest burden. If renewal is deferred, failures and emergency repairs eventually cost more. The options include consolidating facilities, regional cooperation across municipal borders, joint water-and-sewer procurement, remote monitoring, standardization, public-private partnerships, and a mix of centralized and small distributed systems where geography demands it.
The human asset is just as difficult to replace. Water quality, chemistry, civil works, electrical systems, machinery, billing and emergency response take years to learn. Sensors and AI can identify pressure anomalies, leakage signatures and images of pipe interiors. They cannot eliminate the need for people who judge whether an alert is false, choose where to excavate and explain the decision to residents. Digital transformation should give a smaller workforce more time for consequential judgment—not pretend judgment is no longer required.
Companies and residents become more than customers
The 2026 white paper reports that 145 companies were certified as “Water Cycle ACTIVE” companies, while three interested firms entered the “CHALLENGE” category. Factory intake, effluent, site stormwater and supply-chain exposure directly join businesses to their basins. Conservation is only one dimension. Drought production plans, upstream conservation, emergency public access to company wells and water reuse can turn corporate continuity planning into basin resilience.
Residents’ responsibilities likewise extend beyond obeying a conservation request. Rain barrels, emergency drinking-water stores, knowledge of community wells, scrutiny of rates and renewal plans, river cleanups and citizen monitoring all seem small. Yet the difference between Fukuoka in 1978 and 1994 shows how institutions and practiced behavior change harm.
Responsibility cannot be dumped on the household. A shorter shower does not retrofit a purification plant or inspect a corroded sewer. Participation should not blur accountability. It should make clear what each actor can change and how information and costs are shared.
Six tests for turning the white paper into an operating plan
| Priority | Measure | Why it matters |
|---|---|---|
| Renew by consequence | Condition, criticality, alternative route and population affected—not age alone | Directs limited money to failures with the largest harm |
| Move before drought deepens | Exercises, decision speed and actual performance of the 42 timelines | Activates sharing and backup sources before outages |
| Retrofit water and sewer together | Share of hospitals and shelters with continuous service on both sides | Life and medical care do not resume if only one network works |
| Diversify usable sources | Ability to switch among rivers, wells, rain, reclaimed water and interties | Prevents one shortage or failure from stopping the whole service |
| Share expertise | Regional teams, qualified staff, training and standardized data | Gives small utilities access to specialist judgment |
| Show the cost over time | Renewal now versus failure, emergency repair and rate effects after delay | Turns a debate about price into an intergenerational choice |
Four centuries in which water built the city
Early 17th century The Kanda waterworks supports Edo. Work on the Tamagawa Aqueduct begins in 1653; supply starts in 1654.
1887 Japan’s first modern waterworks begins service in Yokohama. Filtration, pressure and iron pipe transform sanitation and firefighting.
1890 The Waterworks Ordinance establishes a national framework for modern urban systems.
1964 The “Tokyo Desert”: 84 days of intake restrictions, reaching 50 percent, accelerate Tone River development.
1965–67 Emergency water begins moving through the Musashi Canal; the completed link connects Tone water to the metropolitan system.
1978 Fukuoka endures 287 days of restriction and turns toward conservation, reclaimed water and centralized distribution control.
1994 A nationwide drought. Fukuoka restricts for 295 days but dispatches no water trucks.
2014–16 The Water Cycle Basic Act, the first basic plan and the first annual Water Cycle White Paper.
2024 The Noto earthquake cuts service to about 136,000 households. The basic plan is revised early.
2025 The Yashio collapse prompts temporary sewer curbs for about 1.2 million people; summer brings the first national drought headquarters in eight years.
2026 The white paper treats drought, aging assets and worker shortages as one water-cycle risk.
Who protects the next glass?
The 2026 white paper’s most important warning is not that Japan has no water. It is that the system that turns natural water into social water was built around the climate, population and city patterns of the past.
Edo read the gradient and moved water 43 kilometers by gravity. Meiji Japan used filtration and iron pipe to build a healthier city. High-growth Japan met swelling demand with dams and regional conveyance. Fukuoka converted the memory of drought into control systems and reuse. Each era translated its water problem into a new institution and a new technology.
The Reiwa translation is harder. It must manage flood and drought in the same basin; rank aging pipes by condition and consequence; retrofit water and sewer as one service; protect groundwater and rainwater for emergency use; and share the cost of renewal across a shrinking population. It must employ sensors and AI while cultivating the people who can make the final decision.
A glass from a Japanese tap is a compact agreement among rain, forest, river, reservoir, aquifer, farms, factories, buried pipes, user charges and technical labor. If that agreement remains invisible, the next visible sign may be an empty reservoir or a hole in the road. Repairing it while it can still be seen—that is how a land of water becomes a water-resilient country.
Reporting note and principal sources
This article uses public information checked through August 7, 2026, at 9:02 a.m. JST. The 2026 white paper is the annual report on measures taken during fiscal 2025. Japan.co.jp supplemented it with earlier white papers and primary material from national and local authorities. Climate projections are scenario-based national averages, not deterministic forecasts for any one river basin. English renderings of Japanese titles and policy terms are Japan.co.jp translations.
- Cabinet Secretariat: Cabinet approval of the 2026 Water Cycle White Paper
- Cabinet Secretariat: Water Cycle White Papers archive
- MLIT: Drought records, including summer 2025 and winter FY2025
- MLIT: Seismic resilience and earthquake damage to water systems
- MLIT: The Yashio road-collapse accident
- Japan Meteorological Agency and MEXT: Climate Change in Japan 2025
- Cabinet Secretariat: 2024 Basic Plan on Water Cycle Policy
- MLIT: The condition and challenges of Japan’s water resources
- MLIT Kanto Regional Bureau: Rainfall and per-capita water resources
- Tokyo Waterworks: History of the Tamagawa Aqueduct
- Yokohama City: Japan’s first modern waterworks
- MLIT Kanto Regional Bureau: The Musashi Canal
- Fukuoka City: Records of the 1978 and 1994 droughts
- Fukuoka City: Centralized distribution control
- Cabinet Secretariat: 2020 Water Cycle White Paper retrospective from 1964