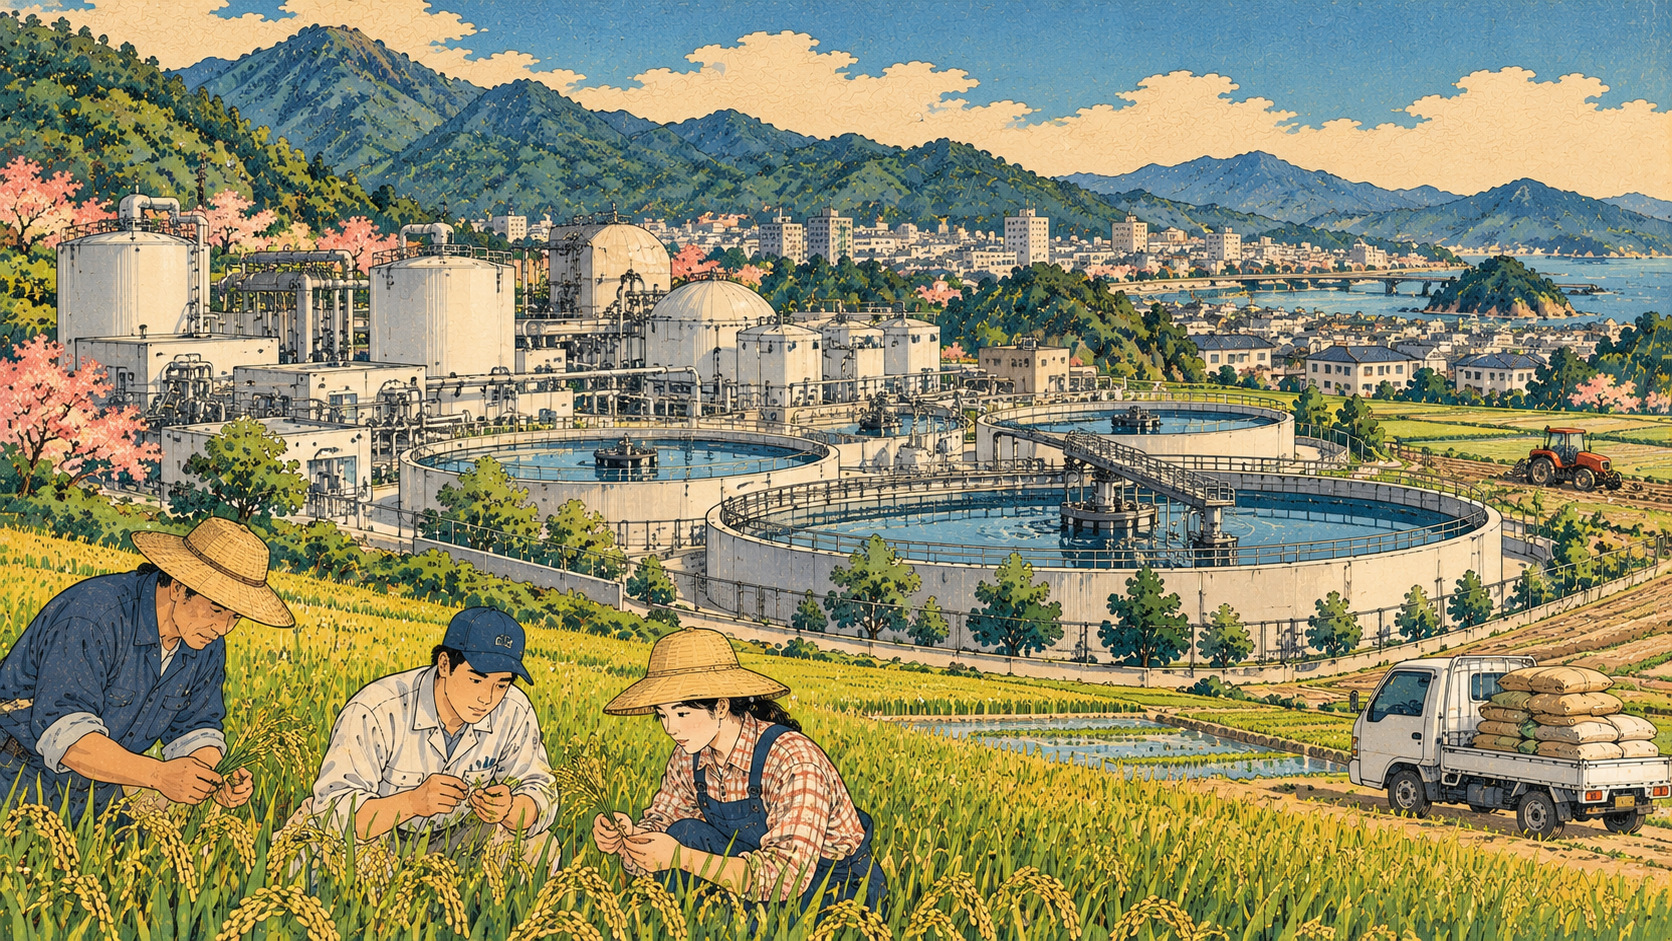
Studying fertilizer recovery is not the same as delivering fertilizer to farms. The new data reveal the gap.
The city’s wastewater may hold something its farms need
Every day, Japan’s sewage plants separate water from sludge containing microbes, organic matter and nutrients. Some of that residual material can be turned into fertilizers rather than discarded or put to other industrial uses. On October 22, 2026, the Ministry of Land, Infrastructure, Transport and Tourism released a dashboard allowing municipalities to compare both how much sludge they already use for fertilizer and how far they have progressed in studying that option. The announcement sounds mundane. Its significance lies in connecting two national vulnerabilities: the costs of handling urban waste and agriculture’s dependence on imported fertilizer materials. The government has opened a way to scrutinize what cities are doing—not announced that the problem has been solved.
A dashboard with two measures, not one league table
The tool distinguishes the sludge fertilizer-use rate from the progress of feasibility work. The first measures the share of sewage sludge produced, on a dry-weight basis, that is actually used as fertilizer. The second describes how far a local authority has moved through the work of evaluating fertilizer recovery. Those figures are not substitutes for each other. A plant that has long sent material to a contractor for fertilizer production may have a high use rate without undertaking an elaborate new feasibility process. Another municipality may have studied engineering solutions carefully while still lacking a product it can sell or distribute. Treating the progress number as proof of fertilizer output would produce a misleading ranking.
An awkward finding for Japan’s biggest cities
The ministry notes a counterintuitive pattern: ordinance-designated cities and regional sewerage systems generally show relatively advanced consideration of fertilizer conversion, yet comparatively low actual fertilizer-use rates. Its explanation is tentative. Big urban plants can generate far more sludge than nearby farms can absorb, making the matching of supply and agricultural demand difficult. A smaller authority may have a ready processor or buyer, enabling high utilization with less visible preparatory work. That does not make small towns universally more efficient or large cities less committed. Transport costs, land availability, regional cropping patterns and the condition of treatment contracts all matter. The value of the dashboard lies in inviting those follow-up questions.
From 15.5% in 2024 toward 30% in 2030
Official ministry material records approximately 2.34 million metric tons of sewage sludge generated in fiscal 2024, measured on a dry-weight basis. About 361,000 tons, or 15.5%, were counted as utilized for fertilizer. Japan’s target is a 30% sludge fertilizer-use rate by fiscal 2030. A related food-security policy calls for doubling the use of compost and sewage-sludge resources from a 2021 baseline by 2030. Another target would bring domestic resources to 40% of phosphorus used in fertilizers. Those are different indicators, with different denominators and scopes. Combining them into a single promise to double all fertilizer self-sufficiency would conceal precisely what policymakers are measuring.
Recycling sludge is hardly a new invention
Long before this dashboard, Japanese sewage systems found routes for their solid residuals: cement and other construction materials, solid fuel, biogas, compost and phosphorus recovery. Their priorities changed as sanitation networks expanded, treatment technology improved and environmental expectations grew. The ministry had already issued technical guidance on phosphorus recovery from sewage systems in 2010. In March 2023 it instructed municipalities to give fertilizer use priority when considering sludge treatment options. The new development in October 2026 is transparency across municipalities, rather than discovery of a substance nobody knew could be useful. The distinction matters because good infrastructure journalism follows changing incentives as closely as new machines.
A nutrient supply chain exposed to the world
Plants need nitrogen, phosphorus and potassium. Japan relies heavily on overseas sources for the raw materials of conventional chemical fertilizers, leaving farms sensitive to world prices, trade disruptions and shipping costs. Recovering phosphorus or organic fertilizer ingredients from domestic wastewater could create a partial substitute and diversify supplies. It is not a direct one-for-one replacement in every field. Compost, ash-derived materials and recovered phosphorus compounds vary in nutrient concentration, handling characteristics and production cost. Nor is total sludge weight equivalent to usable phosphorus. To know whether the system materially improves food security, researchers must measure nutrients delivered in forms that farmers can actually use, with documented product quality and a realistic financial comparison.
Why the fertilizer price shock changed the conversation
The supply disturbances and price spikes around 2022—including consequences of Russia’s full-scale invasion of Ukraine—made the weakness of import-dependent agricultural inputs more visible. Japanese policy subsequently put greater emphasis on domestic nutrient resources and secure supply chains. The December 2022 food-security package and later agriculture and infrastructure plans reflect that shift. Yet “made in Japan” does not automatically translate into inexpensive. High-temperature treatment, drying, processing, packaging, storage and distribution can consume energy and money. A domestic recovery project is best evaluated against the costs it replaces, the transport it adds and the reliability it delivers. The dashboard does not answer those questions on its own.
Safety is part of the business model, not an afterthought
Sewage-derived materials have to earn trust through analysis, standards and responsible use. Concentrations of heavy metals, nutrient content and other relevant contaminants must be checked under applicable fertilizer and environmental requirements. Official programs support analysis of sludge constituents, and Japan’s agriculture ministry emphasizes product quality and safety as it promotes resource substitution. An assertion that all sludge-derived fertilizer is inherently hazardous would ignore variation among treatments and tested products. Equally, claiming every product is safe without seeing its data would be irresponsible. Farmers need consistent laboratory results, a clear regulatory status and guidance on how much to apply. Those requirements affect cost as much as public confidence.
Logistics may be harder than chemistry
Wastewater plants are usually located near population centers. Productive farmland and the demand for specific fertilizer formulations may be some distance away. Moving wet sludge is expensive; drying or granulating it can help but adds capital and operational demands. A farmer needs a reliable product at the right stage of the growing season, not merely proof that a treatment plant can manufacture it. Distribution partners, storage space, pricing, application equipment and long-term purchasing arrangements determine whether a circular supply chain is viable. For large cities, the quantity of material requiring an outlet can overwhelm nearby demand. A high feasibility-progress score may therefore conceal a serious marketing and logistical problem.
The trade-off with cement, energy and other outlets
Not every ton newly assigned to fertilizer comes from landfill. In fiscal 2024, about 1.18 million dry tons of sludge went to construction-material uses, the largest category in government statistics; other volumes supported energy or fuel uses. The overall sludge recycling rate was about 76%. Redirecting material from cement manufacture to farms can have different environmental consequences from diverting material that would otherwise have been discarded. An honest comparison needs to account for treatment energy, emissions, freight distances, nutrient value and the displaced industrial input. A circular economy has competing pathways, not a single automatic winner. The government’s 30% fertilizer-use ambition should be assessed alongside those other material and energy markets.
How readers can use the new data
The ministry provides the dashboard as a downloadable file with three worksheets, rather than a continuously updated online map. It invites users to look at utilization and investigation side by side and to compare local governments facing very different conditions. A municipality with substantial existing fertilizer use is a place to ask who buys the product and why. One with advanced investigation but little use invites questions about economics, contamination controls and farm demand. The dashboard is not, by itself, an independently audited record of every commercial sale or every farmer’s outcome. It is a tool for finding leads. Japan.co.jp has not independently surveyed treatment facilities or verified individual local authority rankings for this report.
What real success will look like
Sewers were built above all to protect public health and the environment. If the residual material they collect can also help replenish agricultural soils, they may become part of the country’s food-security infrastructure. But a dashboard score is only an intermediate measure. More revealing evidence would include annual tonnage sold or used by farmers, nutrient content, repeat demand, compliance data, net costs and the extent to which imported inputs were displaced. Those questions can be asked across municipalities precisely because the government has now made its progress information easier to inspect. Japan’s new dashboard is not a declaration that wastewater has become fertilizer everywhere. It is a chance to test where the circular economy works, where it does not—and why.
Sources and verification
Based on the October 22 ministry release, the dashboard guidance and government datasets. Sludge utilization rates use dry-weight definitions. This report does not independently rank municipalities or claim new interviews with farmers or treatment operators.
- MLIT: October 22 dashboard announcement
- MLIT: Dashboard download, methods and definitions
- MLIT: Sewage sludge fertilizer strategy and support
- MLIT: FY2024 statistics and FY2030 targets
- MAFF: Domestic fertilizer resources and supply security
- MLIT: Treatment plants supplying sludge-derived fertilizer
- MLIT: History of sewage sludge materials and energy recovery
- MAFF: Practical cases and quality safeguards