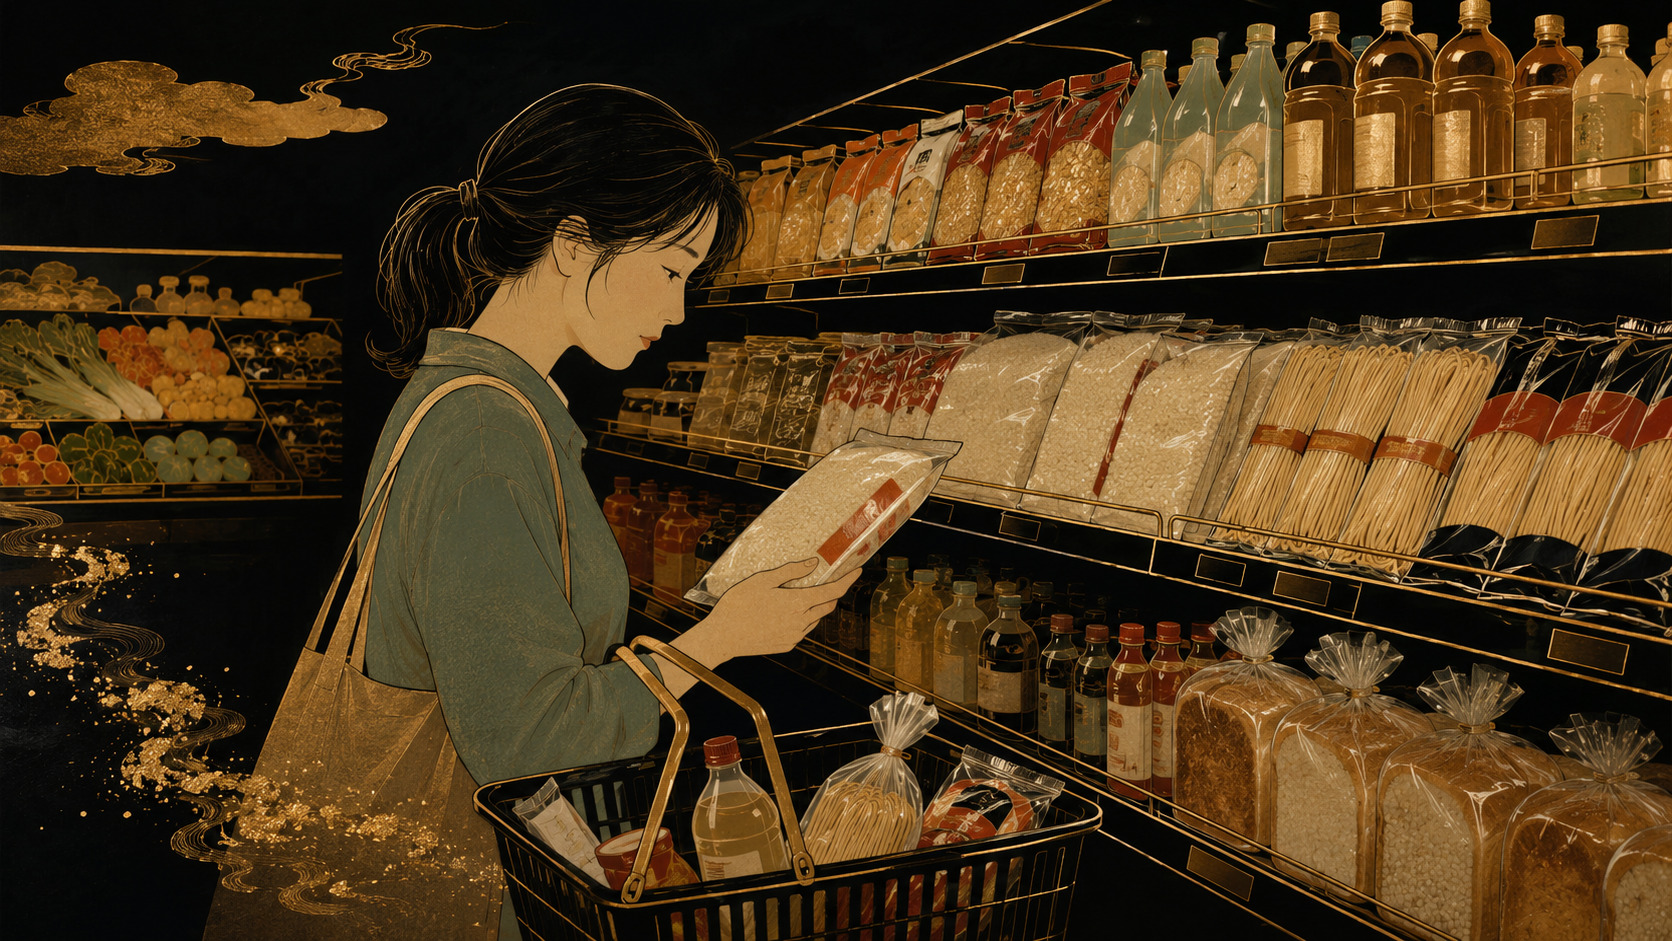
The price reset begins with the foundations of an ordinary Japanese meal. Soy sauce, vinegar, noodle sauces, mayonnaise and dressings account for hundreds of the September changes. Frozen and chilled foods add hundreds more. Butter, cheese, snacks and soft drinks widen the effect from the kitchen to the lunchbox.
Teikoku Databank identified 4,923 food and beverage items scheduled for increases this month among 195 major manufacturers, primarily products sold to households. That is more than three times the 1,467 counted in September 2025 and the highest monthly total of 2026. The average increase per price action is 11%.
The scale is exceptional without being unprecedented. Since the survey series began in 2022, only three months have produced larger counts: October 2022 with 7,864 items, February 2023 with 5,639 and April 2023 with 5,404. September 2026 ranks fourth, placing it closer to the first post-Ukraine price shock than to a normal month.
Two aisles contain most of the shock
Seasonings lead with 1,959 items, 39.8% of the total. The category ranges across soy sauce, dipping and noodle sauces, vinegar, mayonnaise and dressings—products bought repeatedly and used across many meals. Processed foods contribute another 1,848 items, or 37.5%, led by frozen, chilled and fish-paste products. The category has exceeded 1,000 increases for three consecutive months, something not seen since the intense February–April period of 2023.
Beverages and alcoholic drinks account for 466 items. Dairy contributes 278, nearly twice the year-earlier September level. Confectionery contributes 272 and bread 100. Seasonings and processed foods together make up 77.3% of the wave, concentrating the impact in products that help determine the recurring cost of eating at home.
| Category | September items | Share | Representative products |
|---|---|---|---|
| Seasonings | 1,959 | 39.8% | Soy sauce, noodle sauce, vinegar, mayonnaise and dressings |
| Processed foods | 1,848 | 37.5% | Frozen foods, chilled foods and fish-paste products |
| Alcoholic drinks and beverages | 466 | 9.5% | Soft drinks and some shochu products |
| Dairy | 278 | 5.6% | Butter, cheese and infant formula |
| Confectionery | 272 | 5.5% | Potato chips and other snacks |
| Bread | 100 | 2.0% | Packaged household bread products |
| Total | 4,923 | 100% | Shares may not sum exactly because of rounding. |
The difference between a press release and a shelf label
Company announcements show how much variation sits inside the aggregate. Kikkoman is raising suggested retail prices on 153 soy-sauce items by 5% to 9%. Its 47 noodle-sauce and ponzu items carry a 5% to 22% range, while 47 meat-sauce items rise 6% to 11%. Del Monte drinks and several smaller categories take that announcement to 291 items. Separately, Kikkoman Soyfoods is raising 56 soy-milk items by roughly 6% to 20%.
Mizkan lists 67 household items across vinegar, noodle sauce and Chinese-seasoning products, with suggested prices rising approximately 7% to 26%. Morinaga Milk Industry covers 61 items: ice cream, household butter and cheese, infant formula, skim milk and related products. Calbee expects selected potato-chip shelf prices to rise about 5% to 10%.
Those are company statements, not a uniform retail command. Japanese releases variously specify goods delivered to customers, products shipped by the manufacturer, suggested retail prices or expected shelf changes. A supermarket holding old inventory may delay a change. Another may maintain a promotion, substitute its private-label line or raise the everyday price while offering more points. A manufacturer's September 1 date is therefore the beginning of transmission, not a nationwide moment when every label flips.
A stack of costs, not a single cause
Raw ingredients dominate manufacturer explanations, but they are only the first layer. Packaging, electricity and fuel, transport, wages and currency movements recur in official company releases. Kikkoman cites ingredients together with packaging materials, energy, logistics and labor. Mizkan uses a similar list and says the change is needed to maintain quality and stable supply. Yamaki describes rising cost at virtually every stage required to deliver its products. These are corporate claims; the releases do not publish independently audited cost breakdowns for each item.
Teikoku Databank's cause analysis for 2026 announcements identified higher raw-material costs in 90.7% of affected items. Logistics appeared in 65.7%, energy in 65.1%, packaging and materials in 63.1%, and labor in 51.3%. The categories overlap, so the percentages cannot be added.
A newer layer comes from disruption in the Middle East. Teikoku Databank links 27.8% of the 2026 increase count to the region's deterioration and resulting pressure on crude oil and naphtha. Petroleum moves through a food supply chain as fuel, freight, film, trays and printing ink even when it is not an ingredient. The survey calls this a Middle East-driven inflation wave, echoing the external shock that followed Russia's invasion of Ukraine.
Only 7.5% of items explicitly cited yen weakness, down from 12% a year earlier. That is not a full estimate of currency exposure. Exchange rates can already be embedded in imported ingredients, energy or packaging costs rather than identified separately.
Japan's price-reset era
The deeper history is a change in business behavior. For much of Japan's long deflationary period, food companies resisted visible list-price increases, absorbing costs, changing package size or limiting promotions. Ministry of Agriculture material describes food consumer prices as subdued during the long deflation, beginning to rise around 2014 and accelerating sharply after 2020.
Teikoku Databank counted 25,768 food price increases in 2022 and 32,396 in 2023. Russia's invasion disrupted grain, edible-oil and energy markets as the yen weakened rapidly. The number fell to 12,520 in 2024, but prices did not return to their earlier level. The lull reflected fewer new resets, not broad deflation.
The count rebounded to 20,609 in 2025. By August 31, companies had already announced or implemented 19,083 changes for January through November 2026. Processed foods alone reach 6,775, about 41% above the full-year 2025 total. Confectionery and food ingredients have also passed their prior-year counts.
The average disclosed increase for the 2026 items is 13%, below 15% in 2025. That pairing—more products, at a somewhat lower average rate—suggests inflation spreading across a broad range rather than only a few spectacular jumps.
2022 · 25,768 items: Grain, oil, energy and currency shocks spread after Russia's invasion of Ukraine.
2023 · 32,396: The highest annual count in the series; February and April each exceeded 5,000.
2024 · 12,520: Fewer new resets, but no broad return to pre-shock prices.
2025 · 20,609: Increases accelerate again across seasonings, drinks, dairy and bread.
2026 · 19,083 known: January–November announcements identified by August 31; not a final full-year total.
Why 4,923 is not an inflation rate
The count gives a small-selling sauce the same one-item weight as a nationally dominant staple. It counts repeat increases and shrinkflation. The Consumer Price Index does something different: Statistics Bureau staff measure retail prices and weight goods and services according to household spending.
Japan's latest national CPI, for July 2026, rose 1.9% from a year earlier. Food rose 3.5%, and food excluding fresh items rose 3.0%. Within that basket, confectionery was up 6.1% and beverages 5.5%. Green tea was 29.2% higher and potato chips 13.3%. Those are July observations; the index does not yet contain September's new actions.
The distinction prevents two opposite errors. The tripling of September's item count does not imply that the food CPI will triple. But a moderate headline CPI does not make food pressure trivial, because food is bought frequently and has been rising faster than the overall basket.
Household-survey data add a second caution. Real spending by two-or-more-person households fell 3.3% from a year earlier in June, while real income for worker households rose 2.2% when adjusted by the overall CPI. One month cannot establish a causal response to food inflation. It does show why a recovery in average income can coexist with strain in categories whose prices rise faster than the average.
Japan.co.jp analysis: five measures that reveal the household effect
- Unit price: Compare cost per 100 grams or 100 milliliters, not the package price alone.
- Package size: An unchanged sticker with less product is a higher effective price.
- Purchase frequency: A small increase on a weekly staple can matter more than a large one on an occasional item.
- Promotion: Fewer discounts or reward points can raise the amount paid without changing the list price.
- Substitution: Switching brands, sizes or private-label goods is invisible in a manufacturer announcement count.
October brings a second crest
September is not the end of the schedule. As of August 31, 3,033 items were set to rise in October and 659 in November. July through October are on course to produce four consecutive months above 2,000 items, the first such run since June–October 2022.
Teikoku Databank expects 2026 to exceed 20,000 items for a second consecutive year and likely pass 2025's 20,609. The currently known 19,083 is not a final count: December announcements, revised plans and corrections can change it. The survey's September data themselves may also be revised as manufacturers update their schedules.
Oil, currency and weather can ease or intensify the external layer. Labor and logistics costs are less likely to reverse quickly. That leaves Japan with a different kind of food inflation from the first 2022 shock: recurring global disruptions landing on a domestic cost base that has already moved higher.
The next decisive evidence will come from September's retail prices, package sizes, sales volumes and CPI—not from the announcement count alone. The 4,923 figure tells us that the pressure is broad. What shoppers actually pay will reveal how completely it passed through.
Sources and documents
- Teikoku Databank: Food price revision survey of 195 major companies, September 2026, August 31, 2026 (Japanese; principal source for counts and comparisons)
- Full Teikoku Databank survey report (Japanese PDF; methodology and monthly/annual tables)
- Statistics Bureau of Japan: National Consumer Price Index, July 2026, August 21, 2026 (Japanese PDF)
- Statistics Bureau of Japan: Family Income and Expenditure Survey, June 2026 (Japanese)
- Ministry of Agriculture, Forestry and Fisheries: Material on reasonable price formation (Japanese PDF; long-run food-price background)
- Kikkoman: Product price revision announcement, June 1, 2026 (Japanese)
- Kikkoman Soyfoods: Soy-milk price revision announcement, April 16, 2026 (Japanese)
- Mizkan: Household and commercial product price revision, July 17, 2026 (Japanese PDF)
- Morinaga Milk Industry: Selected product price revision, July 30, 2026 (Japanese)
- Calbee: Price and package-size revision announcement, May 14, 2026 (Japanese PDF)
- Yamaki: Household and commercial product price revision, June 16, 2026 (Japanese)
Reporting was checked against material available by 5:30 AM JST on September 1, 2026. Japanese company names, product categories, effective dates and announced ranges were verified in Japanese primary sources. Corporate explanations are identified as company claims. The 4,923-item count and 11% average are Teikoku Databank survey measures, not a government index or a census of every product sold in Japan. Category shares were calculated by Japan.co.jp from published counts and rounded.
Image rights: © 2026 Japan.co.jp. This AI-assisted editorial illustration may not be republished or reused without prior written permission. For licensing, use the contact page.