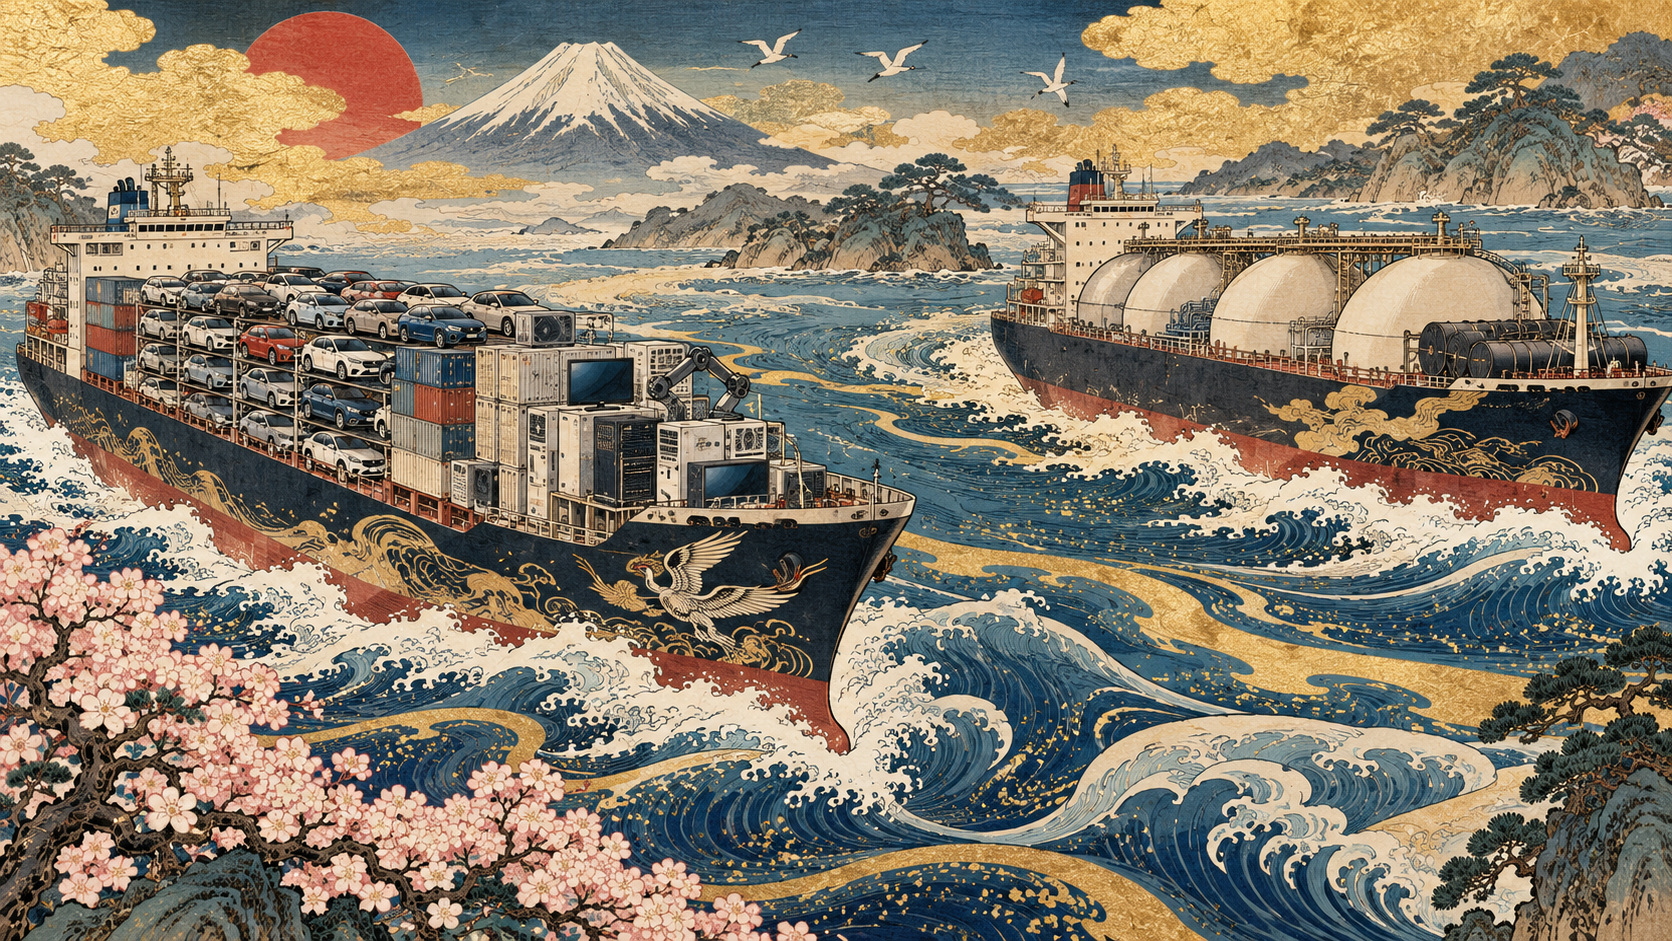
An export boom is not the same thing as an improving trade balance.
The paradox in six months of trade
Japan sold more goods abroad—and still found itself further in the red. Provisional Ministry of Finance figures issued October 21 show exports of ¥63.45695 trillion in April–September 2026, up 18.4% from a year earlier. Imports reached ¥66.275384 trillion, up 20.4%. The resulting goods-trade deficit was ¥2.818434 trillion, almost double the comparable deficit. Strong exports are real; so is the larger bill for what Japan buys. Both can be true at once.
The summer made the difference
Looking at the six months as one block obscures a sharp deterioration. The April–June deficit was ¥525.041 billion; in July–September it reached ¥2.293392 trillion. Roughly 81% of the six-month shortfall therefore accumulated in the latter quarter. April was in surplus, but August registered a ¥1.111913 trillion deficit and September a ¥536.558 billion deficit. These are preliminary customs figures and may later be revised.
A fuel bill that changes the equation
Energy is a significant piece of the puzzle. Mineral-fuel imports totaled approximately ¥12.746 trillion, up 24.5% year over year, and accounted for around 19.2% of total imports. The Middle East conflict and the risks surrounding shipping and supply routes have heightened concern over oil procurement costs. But the deficit cannot honestly be assigned entirely to crude: Japan also imports machinery, components, food and materials, while exchange rates, shipment volumes and prices can move independently.
The price tag is not just the oil price
A dollar-denominated commodity becomes more expensive in yen when the currency weakens, even if the commodity price in dollars does not move. Japan’s import valuations also generally include freight and insurance (CIF), while exports are recorded on a free-on-board basis (FOB). Those conventions are important when comparing the two headline values. To calculate exactly how much of the deterioration came from energy prices rather than volumes, shipping, foreign exchange or other products would require a separate decomposition of the underlying trade indexes.
A surplus with America does not settle the balance
The bilateral picture resists easy slogans. Japan recorded a roughly ¥2.122 trillion goods surplus with the United States, according to the same release; its deficit with China was about ¥4.601 trillion and with Australia about ¥2.423 trillion. Japan buys resources and intermediate goods from some partners and sells manufactured goods to others. A favorable balance with one country does not cancel the wider exposure to commodity imports and fragmented global production.
A counterintuitive Middle East figure
The value of imports recorded from the Middle East actually fell 18.8% from a year earlier in the regional table. That does not, by itself, disprove an energy-price shock: a decline in quantities or a change in sourcing can reduce the value of imports from a particular region even as procurement costs rise elsewhere. Equally, the customs release alone does not prove exactly which rerouting decisions were made or quantify their cost. That requires shipping and commodity-level evidence beyond the headline figures.
The deep structure: imported energy
According to Japan’s Agency for Natural Resources and Energy, the country’s energy self-sufficiency rate was 16.4% in fiscal 2024, below the 20.2% level recorded in fiscal 2010. Its manufacturing, transport and household systems remain exposed to overseas fuel markets. Exchange-rate movements that help some exporters convert foreign sales into yen can at the same time raise costs for domestic businesses dependent on imported inputs.
A problem with a long memory
The March 2011 earthquake, tsunami and nuclear disaster transformed Japan’s power system. Reduced nuclear output increased reliance on thermal-generation fuels, keeping energy imports at the center of policy debates. Global fuel-market turmoil following Russia’s invasion of Ukraine in 2022 renewed the pressure. The 2026 shock is different in its immediate causes, but it underscores the same strategic difficulty: an advanced industrial economy cannot completely insulate itself from external supply disruptions.
Why electricity policy matters—and has limits
In the government’s final fiscal-2024 energy-balance figures, renewables including hydropower supplied 23.1% of electricity generation, nuclear power 9.4%, and thermal power excluding biomass 67.5%. Greater efficiency, renewable generation, grid investment, storage and nuclear operations could affect future import dependence. Yet crude oil also goes into transportation and petrochemicals. No single power-sector policy can erase the merchandise trade deficit, and each option poses investment, reliability, safety and environmental tradeoffs.
The corporate squeeze is uneven
Export demand can support revenue while costly feedstocks, freight and imported parts squeeze margins. Businesses selling chiefly within Japan face the same inputs but have different capacity to pass increases to customers. For households, changes may eventually appear in fuel, transport, electricity and food bills. The customs statistics alone cannot establish exactly when or how much individual retail prices will rise; those claims require additional data.
Trade balance is not the current account
A merchandise deficit is not the same thing as a current-account deficit. The current account also includes services and income earned on overseas assets, among other components. Japan’s international investment income is not counted as an export in the customs merchandise figures. This distinction matters when assessing the country’s overall external financial position.
What to watch next
Customs lists November 18 as its next planned trade-release date. Watch the unit prices and volumes of crude and LNG, the yen, key manufactured exports and the regional composition of imports. The central question is whether Japan can capture the rewards of stronger overseas sales without surrendering a growing share of those gains to imported energy and other costs. It is not a story of a country that has forgotten how to export. It is a story of the different vulnerabilities exposed when it exports successfully.
Sources and verification
Based on the October 21 provisional customs release. We have not independently decomposed each price-versus-volume effect, quantified rerouting costs or conducted company interviews. These questions remain open.