Today’s headline is ¥3.3 trillion—not a cheque
The joint meeting of the Council on Economic and Fiscal Policy and the Japan Growth Strategy Council published figures for 62 priority items on June 24. Ocean was one of 17 fields. Its three lines add to ¥3.3 trillion, about $20.32 billion at this issue’s rate of ¥162.39 per dollar.
The method matters. The document is labeled a draft, and its amounts are the scale “currently envisaged.” Responsible departments asked major companies and organizations about plans and outlooks. Where future commitments were unclear, they used market growth and trends. Public involvement was estimated mechanically according to scenarios in which a technology moves from research through demonstration, commercialization and mass production. The government says assumptions will be refined through budgeting and repeated review.
At the 24th meeting of the Headquarters for Ocean Policy on June 29, the ocean roadmap was discussed again. The prime minister’s directions raise political priority; they do not replace Diet authorization, individual grants, procurement contracts or investment decisions by corporate boards. The text of the Japan Growth Strategy shown on June 30 was also a draft. As of this article’s July 17 evidence cutoff, the strategy remained in a summer policy process.
The three pillars, in numbers
| Priority ocean item | Envisaged investment | Government objective | Modeled ripple effect |
|---|---|---|---|
| Marine unmanned vehicles (“marine drones”) | ¥1.2tn (about $7.39bn) | 30% of the world market; roughly $4–5bn in market capture in about ten years; export a high-value service model | ¥9.4tn |
| Maritime domain awareness (MDA) | ¥1.2tn (about $7.39bn) | Upgrade MSIL and deploy Japanese MDA services to about eight countries by the early 2030s | ¥8.7tn |
| Innovative seabed-development technologies and systems | ¥0.9tn (about $5.54bn) | Begin commercial manganese-nodule production in the early 2030s; demonstrate rare-earth mud at industrial scale before seeking future commercial production | ¥2.2tn |
An economic ripple effect is modeled activity in supply chains and the wider economy. It is not a company’s sales, an investor’s return or government revenue. The three values add to ¥20.3 trillion, about $125 billion, but the published material does not expose enough of the model, overlap treatment or sensitivities to reproduce that total independently.
The same warning applies to the national figure. The government says it removed duplication across the more-than-¥370-trillion total, but some items lack a number through FY2040 and more items may be added. It is a cumulative flow, primarily domestic, over roughly 15 years—not the FY2026 budget.
Pillar one: do not stop at selling a marine drone
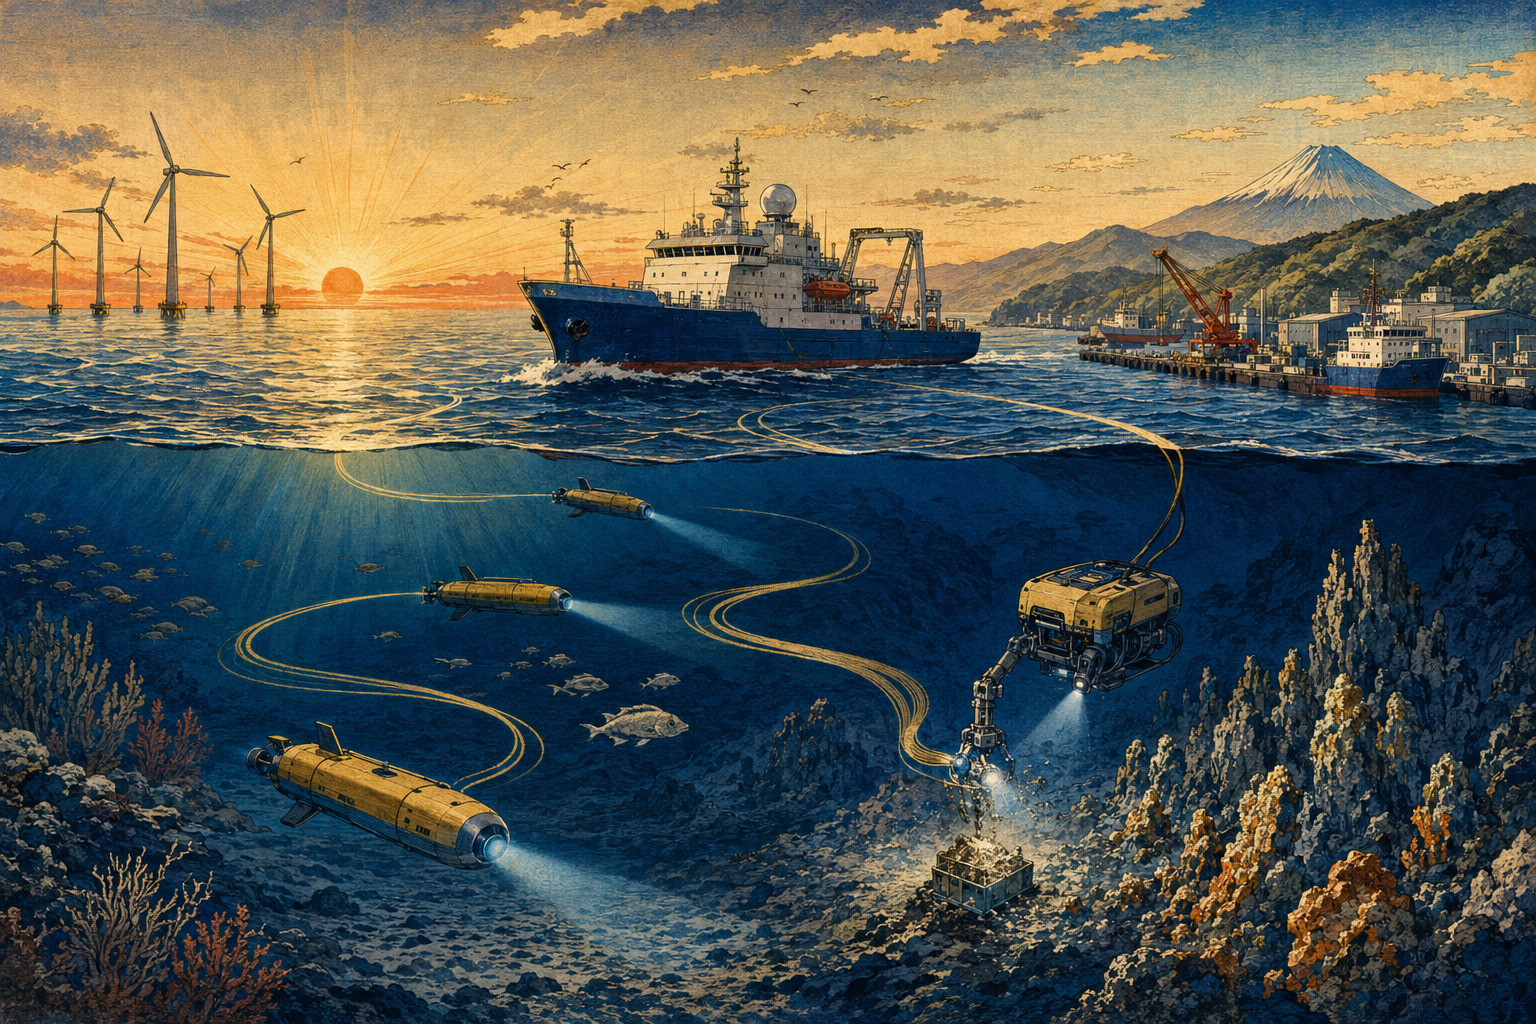
Marine unmanned vehicles include autonomous underwater vehicles, remotely operated vehicles and unmanned surface vessels with different control and operating models. The roadmap illustrates AUVs and USVs, but its industrial chain extends through sensors, underwater communication, subsea charging, swarm control, support vessels, data analysis, maintenance and mission services.
The applications reach well beyond defense and oil and gas: inspection of offshore-wind foundations and export cables, aquaculture monitoring, port and bridge inspection, seabed mapping, post-disaster surveys, ecosystem observation and mineral exploration. In a country losing workers, the machines can remove people from hazardous underwater tasks and repeat survey lines more frequently.
The draft relies on an external estimate that the global market will grow by 8–15% a year and exceed $10 billion around 2030. It then targets a 30% share and $4–5 billion in about a decade. Those figures are policy goals, not a guaranteed forecast; the stated share cannot simply be multiplied by the stated 2030 market because the target horizon and expanding market base are not identical.
Japan has a deep-ocean machine history; industrial depth is different
The lineage includes the 1981 human-occupied Shinkai 2000, the Shinkai 6500 system completed in 1990, the first-generation Kaiko ROV that sampled animals at 10,911 meters in the Mariana Trench and the Urashima AUV program begun in 1998. Japan has accumulated pressure-resistant structures, acoustic communication, navigation and mothership operations over decades.
Urashima made a 317-kilometer continuous run in 2005. Its rebuilt successor, Urashima 8000, reached 8,015.8 meters in the Izu–Ogasawara Trench in 2025. In May 2026, JAMSTEC reported real-time acoustic transmission of sonar imagery from ultra-deep water. These research capabilities give the roadmap a credible base.
One world-class prototype is not an export industry. An industry also requires manufacturable components, insurance, certification, maintenance bases, trained operators, permission to use test waters, failure and recovery systems and a price customers will pay. The roadmap itself acknowledges that Japan’s activity and supplier depth are small relative to Europe and the United States, while talent, test fields, procurement timing, insurance cost and regulatory treatment remain constrained or uncertain.
Government procurement becomes the first customer
Marine robotics has a classic chicken-and-egg problem. Customers will not put an unproven system on critical infrastructure. A manufacturer will not invest in scale and sea trials without credible orders. The roadmap’s central answer is anchor tenancy: create early demand with multi-year public procurement.
Coast guard, ocean observing, disaster response, infrastructure and defense missions can buy operating results, demonstrate groups of different vehicles and bridge toward civil markets. The contract should not merely purchase a prototype. It should specify an outcome: how many square kilometers, how quickly, at what resolution, uptime, accident rate and cost.
That moves companies from hardware sales toward recurring service. It can also lock a market to one vendor if specifications are written around a proprietary architecture. Interoperable communication, data, charging and mission-planning standards—and a clear policy for which intellectual property stays open—must come before fleet scale.
Pillar two: MDA is the ocean’s eyes, nerves and decision layer
Maritime domain awareness combines information from ships, satellites, aircraft, marine robots, floats, radar, weather and ocean systems and seabed mapping to understand events at sea. It can support safe routes, illegal-fishing enforcement, rescue, oil-spill response, tsunami awareness, cable protection, mineral surveys and offshore maintenance.
Japan framed MDA as a policy issue in 2015 and adopted capability measures in 2016. On April 17, 2019, the Japan Coast Guard launched the Maritime Situational Indication Linkages platform, known in Japanese as Umishiru and in English as MSIL, allowing layers held by different agencies to be viewed on a common map. The Fourth Basic Plan made MDA a priority in 2023. A new MDA concept that December described collection as stronger “eyes,” aggregation and sharing as “nerves,” international cooperation as a network and AI-based use as solutions.
The 2026 draft envisages ¥1.2 trillion for observing assets, a stronger MSIL, analysis that turns information into usable services and an ocean digital twin. It aims to deploy Japanese MDA services to roughly eight Indo-Pacific or sea-lane coastal states by the early 2030s, with official development assistance and Official Security Assistance helping build demand.
Open data and security data cannot share one rule
MDA creates economic value when data can be reused for routing, fishing, insurance, wind-farm maintenance and disaster planning. But information about smuggling surveillance, patrol patterns, critical infrastructure and military operations cannot be released unconditionally. The roadmap calls for sharing appropriate to security level and clarity about what business may use.
A single ocean database is not enough. Time, position, depth, uncertainty, calibration, license, commercial confidentiality, classification, retention, APIs and continuity during failure all have to align. Investors need predictable quality and rights, not merely more layers on a map.
MDA export is also more than equipment. Coastal guard, weather, hydrographic, port and fisheries agencies in the partner country need training, maintenance, legal authority and cyber defense. Success in eight countries should be measured through uptime, local operators, response time, data sovereignty and renewed contracts—not the number of memoranda signed.
Pillar three: from a seabed resource to a development system
The ¥0.9-trillion line is broader than a mine. It covers the chain for oil and gas, methane hydrate, seafloor massive sulfides, cobalt-rich crusts, manganese nodules and rare-earth mud: exploration, resource estimation, mining, lifting to the surface, separation and refining, and environmental assessment.
The draft calls for a new full-depth unmanned explorer competitive with the world’s best, simultaneous operation of multiple and different vehicles, replacement of aging research ships and submersibles, and a new deep-ocean platform that may include an ultra-deep support vessel. It models a ¥2.2-trillion ripple effect while acknowledging that no one has yet achieved commercial success with marine minerals or methane hydrate and that technology, resource quantity, economics and environmental effects remain uncertain.
That caution is essential. Geological occurrence is not an economically recoverable reserve. Grade, continuity, recovery, storms, distance, refining, commodity price, waste and environmental conditions decide whether material can be produced at a profit.
February 2026 brought a technical milestone off Minamitorishima
The roadmap gained immediacy from an experiment earlier in the year. A Cabinet Office SIP project and JAMSTEC used the deep-sea drilling vessel Chikyu to raise rare-earth-bearing mud from roughly 6,000-meter-class water around Minamitorishima. The June roadmap cites the February achievement directly.
It was not the beginning of commercial production. It demonstrated part of a mining and lifting system over extreme depth. Ore grade, continuous throughput, reliability, energy, dewatering, transport, separation and refining, waste, environmental monitoring and total cost require separate proof. On June 29 the prime minister told ministers to move quickly on industrial-scale demonstration, cost reduction and refining technology.
The draft gives different timelines to different minerals. It targets commercial manganese-nodule production in the early 2030s. For rare-earth mud, it calls for technology and integrated assessment under the third SIP phase, continued industrial-scale demonstration and only then future commercial output. They should not be presented as identical commitments with the same deadline.
Seabed development sits in two legal zones
Activity within Japan’s exclusive economic zone or continental shelf differs legally from mineral activity in the international seabed beyond national jurisdiction, known under the Law of the Sea as “the Area.” The International Seabed Authority administers mineral activity in the Area. As of March 2026, exploitation regulations were still under negotiation; the Council discussed 29 of 32 major outstanding issues, but had not adopted the code.
The ISA regime is not simply transplanted onto the Japanese EEZ project around Minamitorishima. Even so, international debates over environmental assessment, thresholds, long-term monitoring, compensation, transparency and scientific uncertainty will affect Japan’s domestic legitimacy and the exportability of its systems. The roadmap calls for involvement in international rules and standards with the ISA and partner countries.
Mining plumes, noise, light, benthic life, carbon processes and cumulative effects require a long baseline before extraction. A study begun after disturbance cannot reconstruct what changed. Environmental observation is not an expense to append after a permit; it is pre-investment infrastructure.
The 19-year prehistory: the 2007 Basic Act
Japan’s integrated ocean policy acquired its present architecture in the Basic Act on Ocean Policy, enacted in April 2007 and effective July 20. The Act created the Headquarters for Ocean Policy and required a Basic Plan. Its principles include harmonizing development and use with environmental conservation, safety and security, scientific knowledge, sound ocean industries, comprehensive governance and international partnership.
The First Basic Plan followed in March 2008, the second in April 2013, the third in May 2018 and the fourth in April 2023. Reviewed roughly every five years, the plans have tried to combine ministry-specific policies into a single idea of a maritime state.
The fourth plan marked a stronger turn. It set comprehensive maritime security and sustainable use and development as twin pillars, joining decarbonization, economic security, digital transformation, climate hazards and competitiveness under “Ocean Transformation.” The 2026 roadmap is an attempt to translate that philosophy into named products, customers, dates and money.
The 2024 strategy built the bridge
On April 26, 2024, the Headquarters for Ocean Policy selected six cross-ministry key missions from the wider plan: AUVs, MDA, extending offshore wind into the EEZ, Minamitorishima and its waters, border islands and the Arctic. Missions were designed for annual review and, in principle, a five-year term.
Its AUV target was to develop a Japanese industry capable of overseas expansion by 2030. The MDA mission sought an MSIL Business Platform by FY2029. The Minamitorishima mission was to support an SIP social-implementation plan targeted for FY2027. The 2026 roadmap puts an investment scale and market objective beside the AUV, MDA and seabed-resource arms of that strategy.
The government therefore did not discover ocean investment suddenly in 2026. There is a hierarchy: law, five-year plan, priority missions, demonstrations and now an investment roadmap. The test is whether ministries, budgets, regulation, procurement and indicators connect in one execution table.
The “ocean economy” is larger than the ocean column
The ¥3.3 trillion recorded under Ocean is not a comprehensive value for Japan’s ocean economy. Sea-dependent technologies are classified under other strategic fields. That may make administrative sense, but it matters when reading the scale of investment.
| Adjacent strategic field | Directly ocean-facing item | Envisaged investment |
|---|---|---|
| Resource and energy security / GX | Offshore wind | ¥5.1tn through FY2040 |
| Information and communications | Submarine cables | ¥2.4tn through FY2040 |
| Shipbuilding | Next-generation ships | ¥1.0tn through FY2034 |
| Port logistics | Cargo-handling machinery / Cyber Port | ¥0.4tn / ¥0.2tn through FY2040 |
| Food tech | Land-based aquaculture | ¥2.9tn through FY2040 |
Those five fields add arithmetically to ¥12 trillion, but that is not an official “ocean investment total.” Horizons differ, and the list omits much of shipping, fisheries, tourism, coastal resilience, ports, coast guard and defense, and natural capital. One asset may also serve multiple fields. The government says it deduplicated the ¥370-trillion national total; a reader’s subset has not undergone that process.
Offshore wind is the reality test for a long roadmap
Japan has pursued a 10-gigawatt offshore-wind project pipeline by 2030 and 30–45 gigawatts by 2040. The 2026 investment table places ¥5.1 trillion under the adjacent energy field. A floating wind facility off Goto, Nagasaki, began operation in January 2026. In March, Vestas signed a conditional memorandum toward final nacelle assembly in Japan by FY2029 and a road map toward full nacelle production by FY2039.
At the same time, a selected first-round developer abandoned projects in three areas off Akita and Chiba in 2025 as material, financing, currency, timing and revenue conditions undermined the bids. The economy and transport ministries revised the auction guidance in June 2026, adding an expected price range, giving project feasibility more weight and allowing schedule flexibility.
This is not only a failure story. A 15-year roadmap needs a transparent way to reprice and redesign projects when conditions change. Marine robotics and seabed systems face the same constraints in steel, vessels, ports, labor, insurance, community consent and interest rates.
Do not confuse an annual budget with a 15-year scenario
The government’s FY2026 ocean-budget overview includes ¥25.2 billion for domestic oil and gas surveys and methane-hydrate research; ¥9.5 billion for marine-mineral resource assessment and production technology; the ocean-security platform as part of a ¥31.95-billion overall SIP allocation; and geospatial MDA as part of a ¥1.93-billion program.
These are annual amounts for existing programs, some expressed as portions of wider budgets. They cannot be compared directly with the ¥0.9-trillion and ¥1.2-trillion roadmap lines. Defense, satellites, the coast guard, ports and research vessels contain ocean use too, with potential overlap. “Japan will spend ¥3.3 trillion in FY2026” would be false.
The government is considering a new Strong and Prosperous Japan investment framework, multi-year plans, changes to a general three-year fund rule, separate special-account management for particularly important economic-security fields and bridge bonds backed by repayment resources. Yet the minister declined on June 24 to disclose public-private splits, saying they would be refined in budgeting. Funding and burden-sharing remain the road map’s largest blank cells.
A large future market is not enough for private finance
Banks and infrastructure funds ask where repayment comes from. Who buys the service under a multi-year contract? Who is liable for failure? What rights exist over a sea area? Who pays insurance, currency adjustment, decommissioning, data ownership and environmental damage? A large projected market does not create bankability if those terms are unknown.
Different stages need different instruments: research grants and commissioned work; milestone payments for demonstrations; government procurement for early markets; loans and guarantees for production; private capital for mature assets. Public support should fall as technical risk falls and paying customers grow. A failed demonstration should produce usable knowledge rather than permanent subsidy.
Some MDA security data and basic deep-sea surveying are public goods whose value cannot be captured fully in a fee. The answer is not to privatize everything. It is to define which layers remain publicly funded infrastructure and which can support a recurring service.
Fishers, coastal communities and the environment are design partners
Test waters, wind farms, subsea cables, unmanned missions and mineral projects overlap fishing grounds, routes, landscapes and ecosystems. Treating stakeholders as an obstacle to be bypassed does not accelerate an investable project. It transfers risk into permitting, litigation, cancellation and reputation.
The Cabinet Office has developed a method for investigating how offshore structures may affect migratory fish, explicitly connecting fisheries coexistence and biological conservation. The seabed road map places environmental-impact assessment and long-term monitoring inside the technology system. Removing those components may lower an early budget and raise the long-term cost of permission, finance, export and trust.
Community value should be contractual: port use, maintenance jobs, co-produced monitoring, fisheries data, education, taxes or rent and responsibility after decommissioning. The number of information meetings is not a proxy for whether a community shared decisions and benefits.
One scorecard for all three pillars
| Test | Indicators that matter | False comfort |
|---|---|---|
| Capital | Public money executed, additional private investment induced, project cost of capital | Calling plans or grant awards “investment completed” |
| Marine robots | Paid operating hours, uptime, recovery rate, incidents, cost per km², exports and renewals | Prototype count, exhibitions, one-off trials |
| MDA | Freshness, accuracy, API use, faster decisions, outages, cyber incidents, local operation in eight countries | Number of map layers or memoranda |
| Seabed systems | Resource confidence, recovery, whole-chain cost, energy and emissions, baseline and stop thresholds | Weight of mud or nodules lifted |
| People and place | Operators, maintainers and data staff, women’s careers, local sourcing, fisheries collaboration | Training attendance and meeting totals |
| Governance | Annual disclosure, independent evaluation, failures, accidents, assumption changes and reallocation | Treating modeled ripple effects as achieved output |
Baselines are indispensable. Unless Japan records paid AUV hours, private MDA use and whole-chain deep-sea cost in 2026, it cannot prove improvement in 2040. Reporting should show not only combined capital but how much additional private spending and recurring revenue each yen of public support caused.
Five decisions to watch next
First, what changes when the growth strategy and ocean road map move from draft to formal policy? Second, do FY2027 budget requests disclose the public share, multi-year procurement, funds, guarantees and tax measures for each pillar? Third, will procurement buy measurable outcomes rather than units?
Fourth is the industrial-scale Minamitorishima demonstration. The meaningful report will integrate continuous throughput, concentration, recovery, refining, waste, environment, transport and total cost—not only the mass lifted. Fifth is annual revision: can the government stop, merge or reallocate a line when markets and technology contradict the assumptions?
Connections to adjacent fields matter too. A marine drone that inspects offshore wind, uses MDA, satellite and submarine-cable data, and deploys from next-generation ships and ports turns administrative silos into a market. Without those connections, 17 strategic fields can collapse into 17 subsidy catalogs.
A maritime blueprint must be rewritten at sea
When the government describes Japan as possessing the world’s sixth-largest maritime area under its jurisdiction, area is potential—not income. The economy begins only when a sensor survives a deep and rough sea, a failed vehicle can be recovered, data can be trusted and shared, fishing can coexist, environmental change can be measured and a customer pays again.
The important advance in the 2026 road map is to see AUVs, MDA and seabed resources not as isolated research themes but as a system: vehicles observe; data supports decisions; deep-ocean platforms explore, recover and monitor. Its weakness is that public-private burdens, revenue contracts and stopping rules remain underdeveloped.
¥3.3 trillion is not a conclusion. It is the first price list intended to turn the 2007 Act, four Basic Plans and the 2024 strategy into machines that work at sea, data people use and resource development that can be held accountable. Evidence of success will not be the cumulative headline in 2040. It will be the ability to disclose cost, incidents, environment, communities, customers and failure every year—and use the record to choose the next investment better.
Sources and further reading
- Cabinet Office, materials for the eighth 2026 Council on Economic and Fiscal Policy meeting (June 24, 2026): 17 fields, 62 items, investment roadmaps.
- Material 1, Public-Private Investment Amounts: ¥3.3tn ocean field, adjacent fields and calculation of the ¥370tn-plus total.
- Material 2, Priority Products and Technologies: selection logic and policy direction.
- Material 3, Draft Public-Private Investment Roadmaps: marine robots, MDA, seabed systems, targets, constraints and ripple effects.
- Cabinet Office minister’s post-meeting press conference (June 24, 2026): no disclosed public-private split, budget reform and status of the figures.
- Prime Minister’s Office, 24th Headquarters for Ocean Policy (June 29, 2026): procurement, MDA and Minamitorishima instructions.
- Cabinet Office, 24th Headquarters for Ocean Policy: hearing on the draft ocean road map.
- Cabinet Office, June 30 press conference: draft Japan Growth Strategy and investment framework.
- Basic Act on Ocean Policy: the 2007 architecture and principles.
- Cabinet Office, Basic Plans on Ocean Policy: the 2008, 2013, 2018 and 2023 plans.
- Outline of the Fourth Basic Plan on Ocean Policy (April 2023): security, sustainability and Ocean Transformation.
- Cabinet Office, Ocean Development Strategy (April 26, 2024): six cross-ministry key missions and annual review.
- Ocean Development Strategy, English outline: AUV, MDA, EEZ wind and Minamitorishima targets.
- Japan Growth Strategy Council Ocean Working Group: three meetings, papers and minutes from February–April 2026.
- Cabinet Office, Japan’s Maritime Domain Awareness: the line from 2015–16 to the 2023 concept.
- Japan Coast Guard Report 2019, launch of MSIL: April 2019 operation and the earlier Marine Cadastre.
- Cabinet Office, Overview of the FY2026 ocean-related draft budget: MDA, resources, SIP, coast guard, defense and ports.
- JAMSTEC, URASHIMA8000: AUV history from 1998, the 317km run and 8,015.8m dive.
- JAMSTEC, real-time sonar transmission from URASHIMA8000 (May 15, 2026).
- JAMSTEC history: Shinkai 6500, Chikyu, Kaimei and related infrastructure.
- METI and MLIT, revised offshore-wind auction guidance (June 5, 2026): response to cancellation in three first-round areas.
- METI and Vestas cooperation memoranda (March 9, 2026): conditional Japanese nacelle production road map.
- METI, Goto floating offshore wind begins operation (January 5, 2026).
- Cabinet Office, methods for studying migratory fish around offshore structures: fisheries coexistence and conservation.
- International Seabed Authority, Mining Code negotiations (March 31, 2026): outstanding issues and continuing talks.
- International Seabed Authority Q&A: exploitation before regulations and the national/international jurisdiction distinction.
Editor’s note: This article relies primarily on government, intergovernmental and research-institution material published by July 17, 2026. The June 24 road map is labeled a draft; its investment amounts are current public-private scenarios and its ripple effects are model outputs. We do not describe ¥3.3 trillion as enacted spending, ¥370 trillion as ocean funding or the February lifting test as commercial production. The ¥12 trillion adjacent-field subtotal is this article’s arithmetic and not an official ocean total. Dollar conversions use this issue’s specified rate of 1 US Dollar = 162.39 Japanese Yen and are approximate. The hero is an editorial illustration.