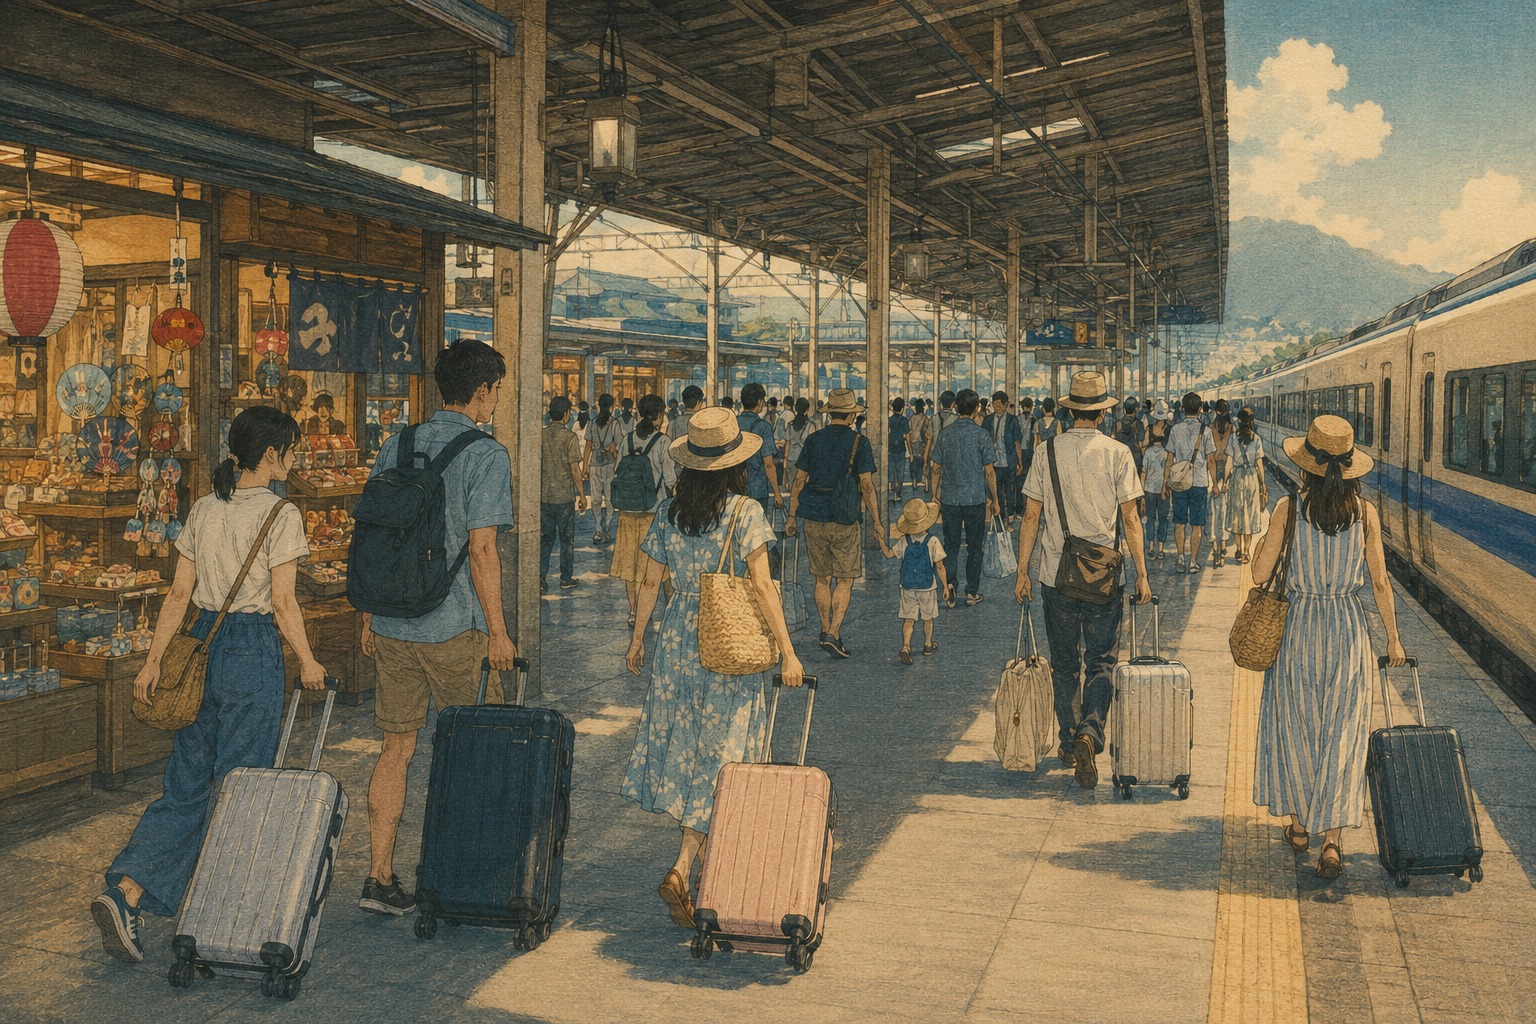
A railway concourse can look only a little busier than last summer while the receipts generated beyond its ticket gates grow much faster. Add the room, the train or flight, meals, shopping and admission charges, and Japan’s domestic travel economy has become a story less about a surge in trips than about the cost and content of each journey.
The Japan Tourism Agency put a precise figure on that divergence on August 19. Its first preliminary estimate for April through June showed ¥7.5361 trillion in domestic travel spending by Japanese residents, an increase of 11.7% from the same quarter of 2025.
The volume measure moved far less. Total person-trips reached 149.58 million, up 3.3%. Expenditure per person-trip rose to ¥50,381, up 8.2%. Multiplying the two rounded growth factors—1.033 and 1.082—produces roughly 1.117. The arithmetic is simple, but its meaning is easy to lose in a headline: most of the nominal market’s expansion came from more money attached to each trip, not from a comparable increase in the number of trips.
Overnight travel did the heavy lifting
Overnight travel generated ¥5.9578 trillion, 13.6% more than a year earlier. The number of overnight person-trips rose 6.4% to 77.43 million, while expenditure per trip increased 6.8% to ¥76,947. Overnight journeys accounted for about 79% of all domestic travel spending in the quarter.
Day trips tell a different story. Spending increased 5.1% to ¥1.5784 trillion, yet person-trips were virtually flat, edging up 0.1% to 72.16 million. The rise in day-trip spending came almost entirely from the 5.0% increase in expenditure per trip, to ¥21,875.
| Category | Travel spending | YoY | Person-trips | YoY | Per person-trip | YoY |
|---|---|---|---|---|---|---|
| Total | ¥7.5361tn | +11.7% | 149.58m | +3.3% | ¥50,381 | +8.2% |
| Overnight | ¥5.9578tn | +13.6% | 77.43m | +6.4% | ¥76,947 | +6.8% |
| Day trip | ¥1.5784tn | +5.1% | 72.16m | +0.1% | ¥21,875 | +5.0% |
Monthly spending was ¥2.2738 trillion in April, ¥3.0063 trillion in May and ¥2.2560 trillion in June. The year-over-year increases were 16.9%, 10.1% and 9.0%, respectively. May, which includes the Golden Week holiday period, produced the most spending; April posted the fastest growth. These monthly figures are components of a preliminary quarterly estimate, not a seasonally adjusted momentum index.
An 11.7% rise in travel spending is not an 11.7% rise in travel.
“Per trip” does not mean the hotel rate
The agency’s expenditure-per-person-trip measure covers the full journey. It can include package or group-tour fees, transportation, accommodation, food and drink, shopping, and entertainment or other service charges. It is not a room rate, a daily rate or an average for every resident.
That makes the 8.2% rise important but diagnostically incomplete. It may reflect higher prices for the same itinerary. It may also reflect longer stays, farther destinations, a shift toward flights or faster trains, more overnight journeys, different travel purposes, or a larger share of travelers choosing higher-priced rooms and experiences. A change in who traveled can move the average even if each person’s behavior does not.
The volume number needs equal care. A person who takes three trips during the period contributes three person-trips. The 149.58 million total therefore cannot answer how many distinct people traveled, how many took their first trip in years, or how many residents did not travel at all.
The underlying government survey is substantial: about 29,000 residents are randomly selected from the Basic Resident Register, and respondents are surveyed four times a year. It asks about the timing and number of trips, purpose, destination and spending. Responses are self-completed by mail, with an online option available since fiscal 2020. But the two-page preliminary release necessarily compresses that design into a few national totals.
Nominal strength is not the same as real growth
The ¥7.5361 trillion is a nominal amount. It has not been adjusted for inflation. The latest national consumer price index available at publication—the Statistics Bureau’s July 2026 release on the 2025 base—showed all-items prices up 1.9% year over year. The index excluding fresh food rose 1.8%, while the measure excluding fresh food and energy rose 1.9%.
Spending per trip rose much faster than those economy-wide measures. Yet subtracting 1.7 from 8.2 would not produce a reliable “real travel” growth rate. The CPI holds a household consumption basket broadly constant to isolate price changes. Expenditure per trip records the basket travelers actually chose. If people stay an extra night, go farther, or switch from a day trip to an overnight visit, per-trip spending can rise even with unchanged prices. If they shorten trips in response to price increases, the average can conceal part of the inflation pressure.
- Prices: higher charges for like-for-like transport, rooms, meals and services.
- Quantity: more nights, more activities or more purchases during a trip.
- Mix: a shift toward longer-distance, overnight or higher-priced itineraries.
- Traveler composition: changes in income, age, purpose and household type among those who traveled.
The defensible conclusion is narrower than “travel inflation caused the increase” and more useful than “tourism is booming.” More nominal yen moved through the domestic travel market, and each person-trip carried substantially more spending than a year before. Explaining why requires the detailed expenditure, purpose and duration tables—and, for prices, the appropriate travel-service indexes.
A market above 2019, with fewer trips than 2019
The pattern is not confined to one quarter. Final agency data show that Japanese domestic travel spending reached ¥26.7845 trillion in 2025, 22.1% above the ¥21.9312 trillion recorded in 2019. Person-trips, however, remained below their pre-pandemic level: 553.13 million in 2025, compared with 587.10 million in 2019, a gap of about 5.8%.
Expenditure per trip bridged—and more than bridged—that volume gap. It rose from ¥37,355 in 2019 to ¥48,424 in 2025, an increase of about 29.6%. Japan recovered the nominal size of its domestic travel market before it recovered the number of trips.
| Year | Domestic travel spending | Person-trips | Per person-trip | What changed |
|---|---|---|---|---|
| 2019 | ¥21.9312tn | 587.10m | ¥37,355 | Pre-pandemic reference year |
| 2020 | ¥9.9741tn | 293.41m | ¥33,994 | Travel collapsed during the first pandemic year |
| 2021 | ¥9.1783tn | 268.21m | ¥34,221 | The market remained deeply depressed |
| 2022 | ¥17.1609tn | 417.85m | ¥41,069 | Recovery accelerated |
| 2023 | ¥21.9101tn | 497.58m | ¥44,034 | Spending nearly returned to the 2019 level |
| 2024 | ¥25.1536tn | 539.95m | ¥46,585 | Nominal spending moved decisively above 2019 |
| 2025 | ¥26.7845tn | 553.13m | ¥48,424 | Spending was 22.1% above 2019 |
In 2020, spending fell 54.5% and person-trips fell 50.0%. The market stayed near that floor in 2021, then expanded rapidly from 2022. Nominal spending was almost back to the 2019 level in 2023 and clearly above it in 2024. Trip volume recovered more slowly throughout.
That history also explains why “record” is a poor shortcut for the new quarterly result. Even where a nominal total reaches a new high, it does not follow that travel frequency, affordability or real service output has set a record. The agency also cautions that figures before its 2009 survey expansion require care when compared with the later series; a clean pandemic narrative is best built within the modern, comparable period.
This is not an inbound-tourism number
Japan’s tourism headlines often lead with overseas visitors. This release does not. It concerns residents of Japan traveling within Japan, and it is separate from the agency’s inbound visitor spending survey.
Domestic residents remain the industry’s broadest foundation. In the agency’s accounting for 2025, total travel consumption occurring in Japan was ¥37.6 trillion. Domestic overnight travel by Japanese residents accounted for 57.7%, and their day trips for another 13.5%. Inbound travel accounted for 25.1%; the domestic portion of Japanese outbound travel supplied the remainder.
The markets interact. Residents and overseas visitors can compete for rooms, train seats, workers and space in popular destinations. A strong inbound season can affect availability and prices faced by domestic travelers. But the Q2 preliminary release does not estimate that causal effect. It would be speculation to assign the rise in domestic per-trip expenditure directly to inbound demand without destination-level and service-level evidence.
A hot travel market can coexist with pressured households
Aggregate travel spending does not describe every household. The Statistics Bureau’s separate Family Income and Expenditure Survey reported average June consumption of ¥290,886 for households of two or more people, down 1.5% in nominal terms and 3.3% after adjusting for inflation from a year earlier.
The two surveys use different samples, concepts and periods, so their totals cannot be reconciled directly. Their coexistence is still a useful warning. A travel market can grow while broad household consumption is weak. People able and willing to travel may accept higher costs or choose more expensive itineraries; others may cut the number of trips or stay home. The average among journeys that occurred then rises without demonstrating broader access to travel.
National aggregates also conceal distribution. The preliminary summary does not show whether spending growth was concentrated among high-income households, older travelers, business travelers or particular regions. Nor does it tell us whether younger families gained or lost travel opportunities. A larger market is not necessarily a wider market.
What travel businesses should—and should not—infer
For hotels, railways, airlines, bus companies, restaurants, shops and attractions, ¥7.536 trillion is evidence of substantial demand. It is not permission to treat an 11.7% revenue increase as an 11.7% increase in foot traffic. Day-trip volume was essentially unchanged, and the strongest growth sat with overnight journeys and per-trip expenditure.
Nor is the data a simple instruction to raise prices. If travelers feel they are paying more for the same product, a strong quarter can borrow demand from the future. Durable growth comes from giving people a reason to extend a stay and a practical way to spend locally: transport links that connect attractions, evening and morning activities, luggage services, local food and craft retail, and booking systems that make small businesses visible.
The revenue seen in this survey is also not profit. Higher room receipts may be absorbed by wages, energy, food, maintenance and financing costs. Travel spending measures the customer side of the transaction; it does not show operating margins, worker income or how much money remains in the host community.
- Revision: how far the first preliminary Q2 estimate moves in later releases.
- Spending category: whether transport, accommodation, food, shopping or services led the increase.
- Duration and purpose: whether longer stays, business travel or a more expensive trip mix drove the average.
- Geography: whether volume and expenditure diverged differently in major destinations and less-visited regions.
- Distribution: whether greater traveler spending reached business profits, wages and local suppliers.
The next question is whether the market became broader
Two Japans fit inside the quarterly total. One is a country in which overnight travel has regained momentum and journeys generate far more nominal spending than before the pandemic. The other is a country where day-trip volume barely moved in the latest quarter and annual trip counts had still not recovered their 2019 level as of 2025.
Policy has to address both. Crowded destinations need capacity, workforce investment and protection for residents’ daily lives. Places that see little demand need compelling reasons to visit and realistic ways to get there. Statistical agencies and policymakers also need to measure who is being priced out, not only how much those who traveled spent.
The ticket gates registered 3.3% more person-trips. The tills registered 11.7% more yen. Between them sits the 8.2% increase in spending per person-trip—the most revealing number in the release.
It may contain higher prices, longer stays, richer itineraries and a changing mix of travelers. The preliminary data cannot yet assign weights to those explanations. That unresolved composition is not a flaw to be covered with a confident slogan. It is the reporting agenda for understanding Japan’s domestic travel economy in 2026.
- Japan Tourism Agency — Travel and Tourism Consumption Trend Survey, April–June 2026, first preliminary estimate (Japanese, August 19, 2026)
- Japan Tourism Agency — Q2 2026 preliminary tables (Japanese PDF)
- Japan Tourism Agency — survey overview and questionnaires (Japanese)
- Japan Tourism Agency — 2025 annual final domestic travel results (Japanese)
- Japan Tourism Agency — 2025 final tables, including the 2019–2025 series (Japanese PDF)
- Statistics Bureau of Japan — Consumer Price Index, July 2026, 2025 base (Japanese)
- Statistics Bureau of Japan — CPI concepts and methodology (Japanese)
- Statistics Bureau of Japan — Family Income and Expenditure Survey, June 2026 (Japanese)
Editor’s note: The Q2 figures are first preliminary estimates and may be revised. All spending amounts are nominal. “Person-trips” count one person taking one trip, not unique individuals; “expenditure per person-trip” is neither a daily rate nor an accommodation price. Shares, 2019 comparisons and the rounded growth decomposition are Japan.co.jp calculations from official data and may differ slightly because of rounding. The displayed exchange-rate timestamp—August 24, 2026 at 7:47 p.m. UTC—has been converted to August 25 at 4:47 a.m. Japan Time. The exchange-rate strip is a reader reference and was not used to convert the official yen-denominated statistics.