- The opening in the ice that made the ocean warmer
- A record that shocked sea-ice observers
- The physics of white ice and dark water
- Why the first weeks of November mattered
- Forty-three melt seasons, satellites and a deliberately simple model
- The opposite summer: 2007–08
- An important mechanism, not a monopoly on causes
- Why Antarctica did not behave like the Arctic
- From wildlife to ocean circulation—and a sea-level distinction
- What climate prediction needs to learn
The opening in the ice that made the ocean warmer
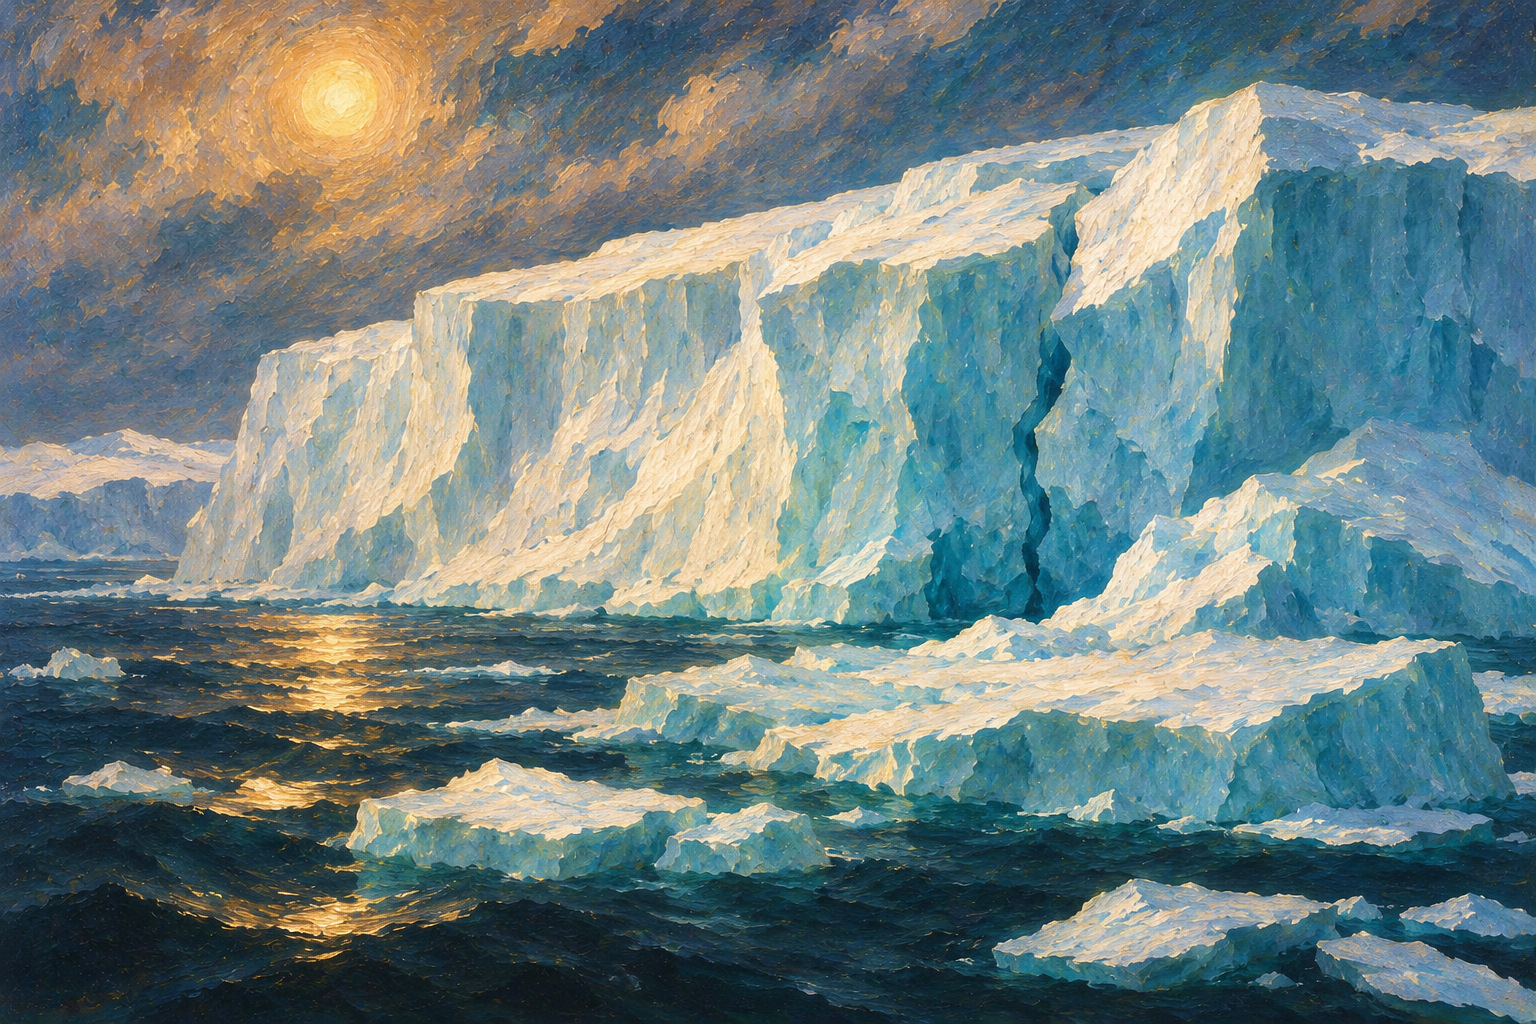
In Antarctic spring, wind can move floating sea ice apart, exposing strips of dark ocean to the returning sun. That sounds like a minor change in a vast polar landscape. But sunlight that bright ice might have reflected can instead be absorbed by the water. The newly warmed upper ocean helps melt neighboring ice, opening still more water and inviting further solar heating.
A peer-reviewed study released November 10, 2026, by scientists at Tomakomai National College of Technology and Hokkaido University argues that this ice–ocean albedo feedback was a significant contributor to Antarctica’s extraordinary summer sea-ice minimum in February 2023. Their institutional announcement followed on November 12. This is a new explanation of an earlier event, not a report of a new November 2026 ice-loss record.
A record that shocked sea-ice observers
The US National Snow and Ice Data Center placed the Antarctic annual minimum at approximately 1.79 million square kilometers on February 21, 2023, the lowest in a satellite record that begins in 1979. The measurement refers to sea-ice extent—the ocean area with sufficient ice concentration to count as ice-covered—not to the land-based Antarctic ice sheet. The distinction matters because floating sea ice and grounded ice affect sea level in very different ways.
It is equally important to read the longer record. The minimums in 2022, 2024 and 2025 were also exceptionally low. Yet February 2026 produced a minimum of around 2.58 million square kilometers, ranking sixteenth lowest in the 48-year satellite record and much closer to the historical average. Antarctic variability is real; a single rebound does not erase earlier anomalies, just as a single low year does not by itself identify its causes.
The physics of white ice and dark water
Albedo describes how much incoming solar radiation a surface reflects. White ice generally reflects substantially more light than dark open water. When wind creates openings in the pack, a larger fraction of the sun’s energy enters the upper ocean. Additional absorbed heat speeds ice melt, which creates more low-albedo water. In climate science, that reinforcing cycle is called a positive feedback, meaning an initial disturbance grows—not that the outcome is beneficial.
The key emphasis of the new study is not merely the familiar idea that warming melts ice. It focuses on where sunlight is absorbed: in the exposed ocean between floes. Seasonal heat-budget calculations in the paper put typical December net surface heating near 150–200 watts per square meter at exposed water, compared with about 10 at ice surfaces in the analyzed conditions. Those are context-specific heat fluxes, not universal constants.
Why the first weeks of November mattered
The researchers identify early to mid-November—the beginning of the Antarctic melt season—as a critical window. Wind-driven divergent ice motion can enlarge openings at just the moment solar input is increasing. If the newly exposed sea surface absorbs extra heat, the result may not become spectacular until December and the late-summer minimum months later.
Their interpretation of 2022–23 is a sequence of events rather than a single culprit. Unusual wind-driven divergence helped initiate more open water in November 2022; solar absorption amplified the anomaly through the ensuing melt season; the minimum was recorded in February 2023. The feedback does not prove that wind alone caused the record or that the same sequence governs every region and year.
Forty-three melt seasons, satellites and a deliberately simple model
Sohey Nihashi of Tomakomai National College of Technology and Kay I. Ohshima of Hokkaido University analyzed satellite sea-ice observations across the seasons from 1979–80 through 2022–23, excluding 1987–88 because of missing December satellite data. They compared sea-ice concentration with wind-forced divergence and estimates of surface heat transfer, then built a simplified coupled sea-ice and upper-ocean model.
The model reproduced important features of two contrasting summers qualitatively. It was not designed as a fully coupled global climate simulation, and its ability to isolate a physical process should not be confused with complete prediction of the Antarctic system. Even the study’s authors explicitly describe its omission of some atmospheric and subsurface-ocean interactions.
The opposite summer: 2007–08
The comparison year is illuminating. During the 2007–08 melt season, wind-related ice motion tended to limit open-water anomalies rather than amplify them. In the study’s interpretation, this meant less solar heat was admitted to the ocean, helping suppress melt and producing a much larger late-summer ice extent than in 2022–23. Those contrasting cases help illustrate why the arrangement of ice at the beginning of melting can shape the months that follow.
There is a crucial seasonal paradox. During the freezing season, an opening created by winds may rapidly lose heat to frigid air and freeze over, contributing to ice growth. During the sunlit melt season, a similar opening can act as a solar heat collector. Wind direction, ice movement and seasonality must be understood together; treating all wind-driven openings as the same process would miss the central argument.
An important mechanism, not a monopoly on causes
The paper does not dismiss other explanations, including warming below the ocean surface, changing atmospheric circulation and pre-existing thinning of ice. Studies have suggested that Antarctic sea ice was roughly 10–15% thinner just before the melt season after 2016 than during earlier decades. In model sensitivity tests, reducing starting ice thickness by 10% and 15% advanced retreat by around four and seven days, respectively.
Those experiments suggest preconditioning matters, but in the authors’ simplified framework it did not fully account for the contrast between the extreme seasons. Subsurface warming trends, cloud responses and the complete coupling of atmosphere, ocean and ice were not explicitly simulated. The scientifically defensible conclusion is that ice–ocean albedo feedback appears to be a key contributor, not that scientists have solved every aspect of Antarctic sea-ice decline.
Why Antarctica did not behave like the Arctic
Since continuous satellite monitoring began around 1979, the Arctic has exhibited a pronounced long-term loss of summer sea ice. Antarctica’s pattern was different. Its sea ice showed large regional variations and a slight tendency toward greater extent through much of the period before the mid-2010s. Since roughly 2016, low summer extents have become conspicuous, culminating in the 2023 record.
A continent encircled by ocean is not a mirror image of an ocean encircled by continents. Antarctic ice is especially sensitive to drifting patterns, ocean currents, the depth and warmth of underlying waters, and regional winds. The historical contrast is precisely why models must represent local interactions rather than simply transplant explanations developed for Arctic summer ice.
From wildlife to ocean circulation—and a sea-level distinction
Antarctic sea ice provides habitat and influences the exchange of heat and gases between the Southern Ocean and the atmosphere. Changes in its seasonal extent may affect ecosystems, the timing of ocean warming, the formation of dense deep water and conditions around vulnerable ice shelves. The new research provides a possible physical link in that broader system, but it does not directly quantify every ecological or circulation consequence.
Floating sea ice melting should not be conflated with loss of Antarctica’s land-based ice sheet. The latter is a major contributor to sea-level rise; melting floating sea ice does not directly raise global sea level in the same way. The study focuses on the area and behavior of seasonal sea ice rather than claiming a measured impact on global sea level.
What climate prediction needs to learn
If early November divergence can materially alter February outcomes, scientists may gain a useful precursor for seasonal predictions. But prediction would require monitoring ice motion, open-water fraction, sunlight, upper-ocean heat storage and later atmospheric changes together. More comprehensive coupled models, additional years of observations and independent tests would show how robustly the feedback travels across regions and unusual seasons.
Antarctica’s record low in 2023 and its partial return toward typical minimum conditions in 2026 are not mutually exclusive stories. They illustrate why both physical mechanisms and natural variability matter. The latest Japanese contribution suggests that a critical part of the Antarctic summer’s future may be decided when the wind first exposes a small patch of dark water to the sun.
Primary sources and methodology
Methodology: Reviewed the peer-reviewed paper, the original Japanese university announcements, and NSIDC satellite-record summaries. We did not independently rerun the climate model or interview the researchers. The study does not establish a single exclusive cause of the record.