More rice fields, less rice for the dinner table
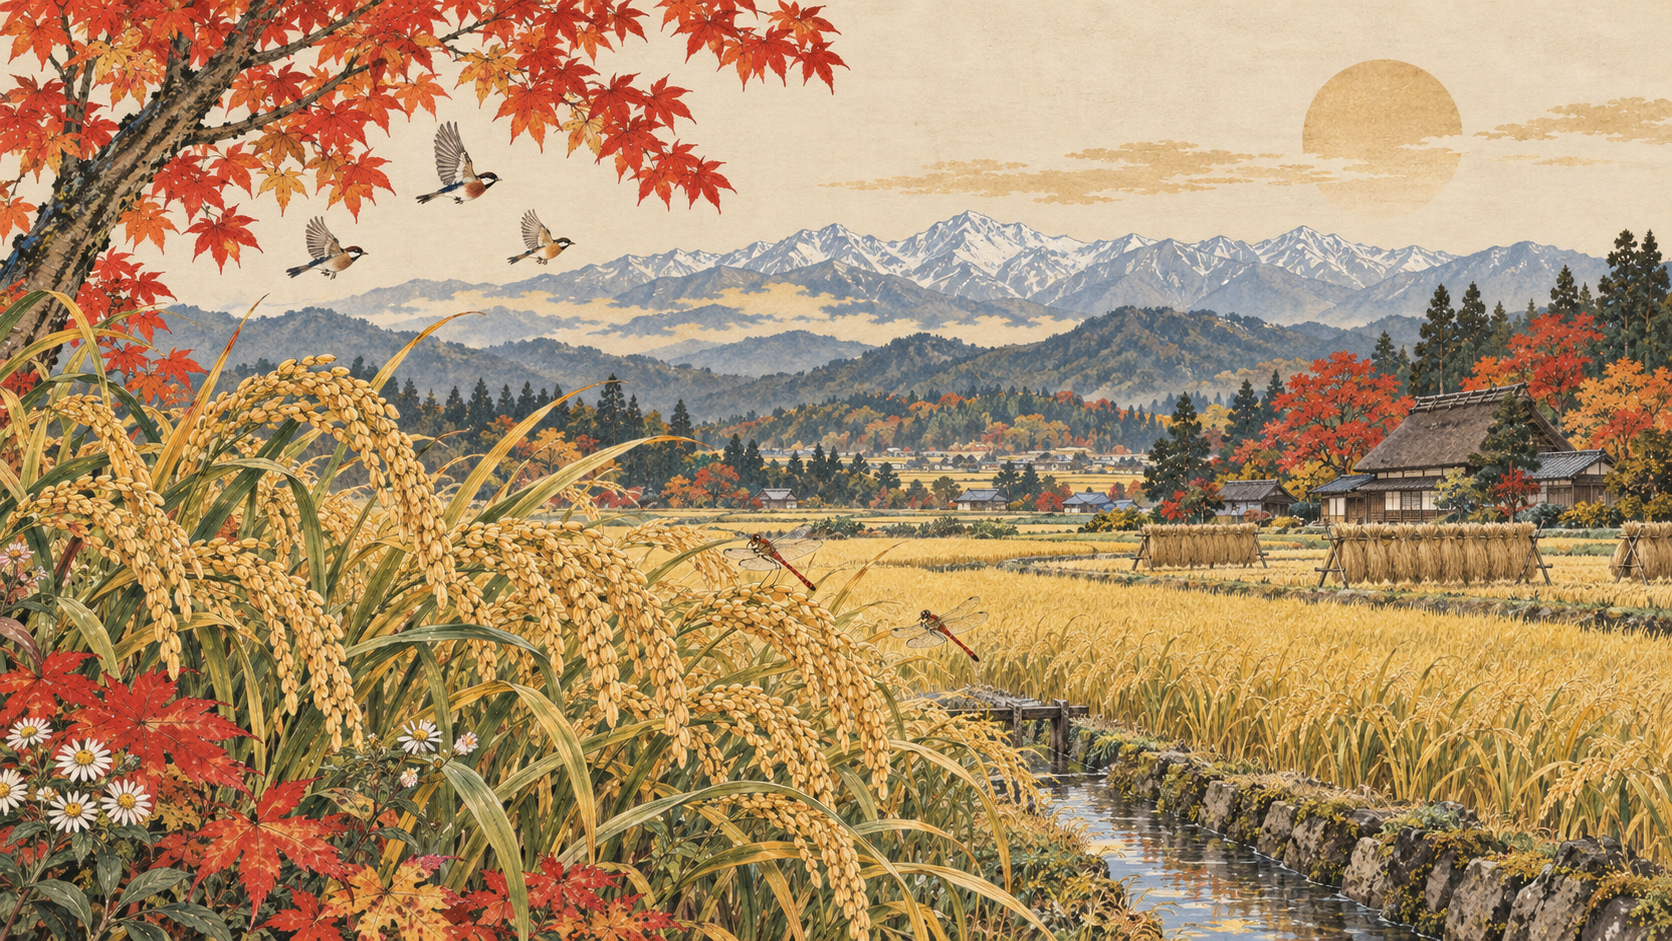
On the Sea of Japan coast, the annual autumn harvest is easy to picture: heavy rice heads, drainage channels, the mountains beyond the plain. Yet an official estimate published October 13 tells a counterintuitive story. The area planted with paddy rice across four Hokuriku prefectures is growing, while the forecast output of rice specifically destined for direct human consumption is falling.
The Hokuriku Regional Agricultural Administration Office, part of Japan’s Ministry of Agriculture, Forestry and Fisheries, projects 950,200 metric tons of table rice based on conditions as of September 25. That is 20,100 tons below the previous crop. But it is not a straightforward regional crop failure: the underlying numbers point to decisions about which uses farmland serves, alongside slightly higher yield per unit of land.
The arithmetic behind a surprising headline
Total area planted with paddy rice, including acreage cut green, is projected at 208,500 hectares, 2,600 more than a year earlier. The area for table rice, by contrast, is 183,000 hectares, 4,700 fewer. Average estimated output on the specified producer-screen basis reaches 520 kilograms per 10 ares, three kilograms above last year.
A hectare is 10,000 square meters; 10 ares are 1,000 square meters. The official 520-kilogram figure translates to 5.2 metric tons per hectare for the relevant measure. Yield improves slightly while the area allocated to table rice shrinks. It is the latter that principally explains why projected table-rice volume falls. Broad agricultural acreage and the quantity available for dinner are simply not interchangeable.
A measurement that begins with a sieve
The statistics use the phrase “producer sieve-mesh basis” (生産者ふるい目幅ベース). Grain is screened to a specified width before the weight counted in the estimate is established. That makes the threshold an essential part of interpreting results, not a technical detail editors should discard.
In Niigata, the ministry identifies a 1.85-millimeter screen; in Toyama, Ishikawa and Fukui, 1.90 millimeters. The 950,200-ton figure is not equivalent to bags of polished rice arriving at supermarket checkouts. Milling losses, quality grades, household stocks and commercial inventories belong to other stages of the supply chain. Comparisons must account for what each statistic actually measures.
How mountains, rivers and engineering made the rice coast
Hokuriku means more here than a cultural name. The reporting region contains Niigata, Toyama, Ishikawa and Fukui, whose fields reflect the interaction of river systems, winter snow and centuries of water management. Alluvial plains became productive only through the continuing work of drainage, irrigation and flood control.
The region’s agricultural history is also an infrastructure story. Government historical records detail large investments in land consolidation, reclamation and waterworks. The modern paddy is not merely a piece of traditional scenery: it is a managed landscape with pumps, canals, embankments, machinery and operating costs. Aging facilities and fewer people available to maintain them present risks distinct from a particular year’s rainfall.
Koshihikari: the innovation behind a familiar Japanese name
The story of modern Japanese rice has deep roots in Hokuriku. A strain developed at the Fukui Prefectural Agricultural Experiment Station, formerly called Etsunan No. 17, became the variety Koshihikari in 1956. It was prized for eating quality, yet posed challenges because of vulnerability to rice blast and lodging. Its eventual success required cultivation knowledge and market demand, not simply an attractive name.
As Japanese households increasingly chose rice by variety and region, producing flavorful branded crops became commercially important. A ministry history records that Koshihikari overtook Nipponbare in nationwide planting share in 1979. The history is relevant today because acreage decisions still embody economic expectations: farmers respond not only to biological yields but also to what buyers will pay for a particular product.
New varieties for a warmer growing season
Koshihikari remains an anchor of regional identity, but Hokuriku is no single-variety economy. Public agricultural sources identify Niigata’s Shinnosuke, Toyama’s Fufufu, Ishikawa’s Hyakumangoku and Fukui’s Ichihomare among the rice varieties associated with continued breeding and quality strategies.
Heat resilience matters. The regional ministry has documented the impact of unusually high temperatures and limited rainfall in 2023 and described adaptation measures. That history helps explain why research and farming techniques are changing. It does not, however, justify presenting the 2026 reduction in table-rice tonnage as proof that a new heat disaster ruined the crop. The published figures demand a more careful reading of planting purpose, acreage and yield.
The other things a paddy field can produce
Rice paddies may serve different end markets, including processed-food ingredients, feed and other designated uses. Farms may also rotate into barley, soybeans and other crops depending on agronomic conditions, market contracts and agricultural programs. The ministry released another set of Hokuriku data on October 13 detailing planting by local agricultural regeneration council as of September 15.
Such local breakdowns matter because a regional total can conceal very different responses among districts. Machinery, labor, drainage, contract prices and policy incentives all shape a farmer’s decision. A fall in table-rice area is neither automatically a retreat from agriculture nor proof that a single policy pushed every farmer in the same direction. The right follow-up is local reporting on why production plans changed.
What harvest figures cannot tell consumers about prices
A smaller regional estimate does not mechanically produce a known retail price. Japan’s rice market depends on output from other regions, inventories from earlier harvests, reserve policy, distribution contracts, milling, transport and consumer purchasing patterns. Predicting October supermarket prices directly from the Hokuriku figure would be misleading.
Likewise, higher prices at checkout do not mean every grower receives a larger profit. Fuel, fertilizer, equipment, irrigation and labor expenses can consume much of the additional revenue. An economically serious account of Japan’s rice problem must look at margins and the financial ability of producers to plant next year—not just the tonnage harvested this year.
A forecast is not the final harvest
The October 13 release reports an estimate based on the crop situation as of September 25. It should not be labeled the final 2026 harvest. The regional office schedules an update using October 25 observations for November, final harvest figures in December and municipality-level statistics the following January. Those later reports could refine the picture.
For now, the insight is already important: rising total paddy area and falling table-rice output can coexist. That apparent paradox tells a more useful story about Japanese agriculture than a simplistic “shortage” headline. The questions to ask next are what kinds of rice growers are choosing, whether their economics remain viable, and how an old rice-producing region can sustain both its landscapes and its food supply.
Sources and documentation
- 令和8年産水稲、9月25日現在の予想収穫量(10月13日公表) — official Japanese source
- 地域農業再生協議会別作付状況(10月13日) — official Japanese source
- 水稲作況調査公表一覧 — official Japanese source
- 北陸の米 — official Japanese source
- 北陸の米・麦・大豆 — official Japanese source
- 作付意向及び作付状況 — official Japanese source
- 北陸農業50年のあゆみ — official Japanese source
- 北陸農林水産統計データ集 — official Japanese source
- 西北陸地域の地形と農業用水 — official Japanese source
Sources reviewed October 13, 2026. The 2026 crop volume is a forecast based on conditions as of September 25.