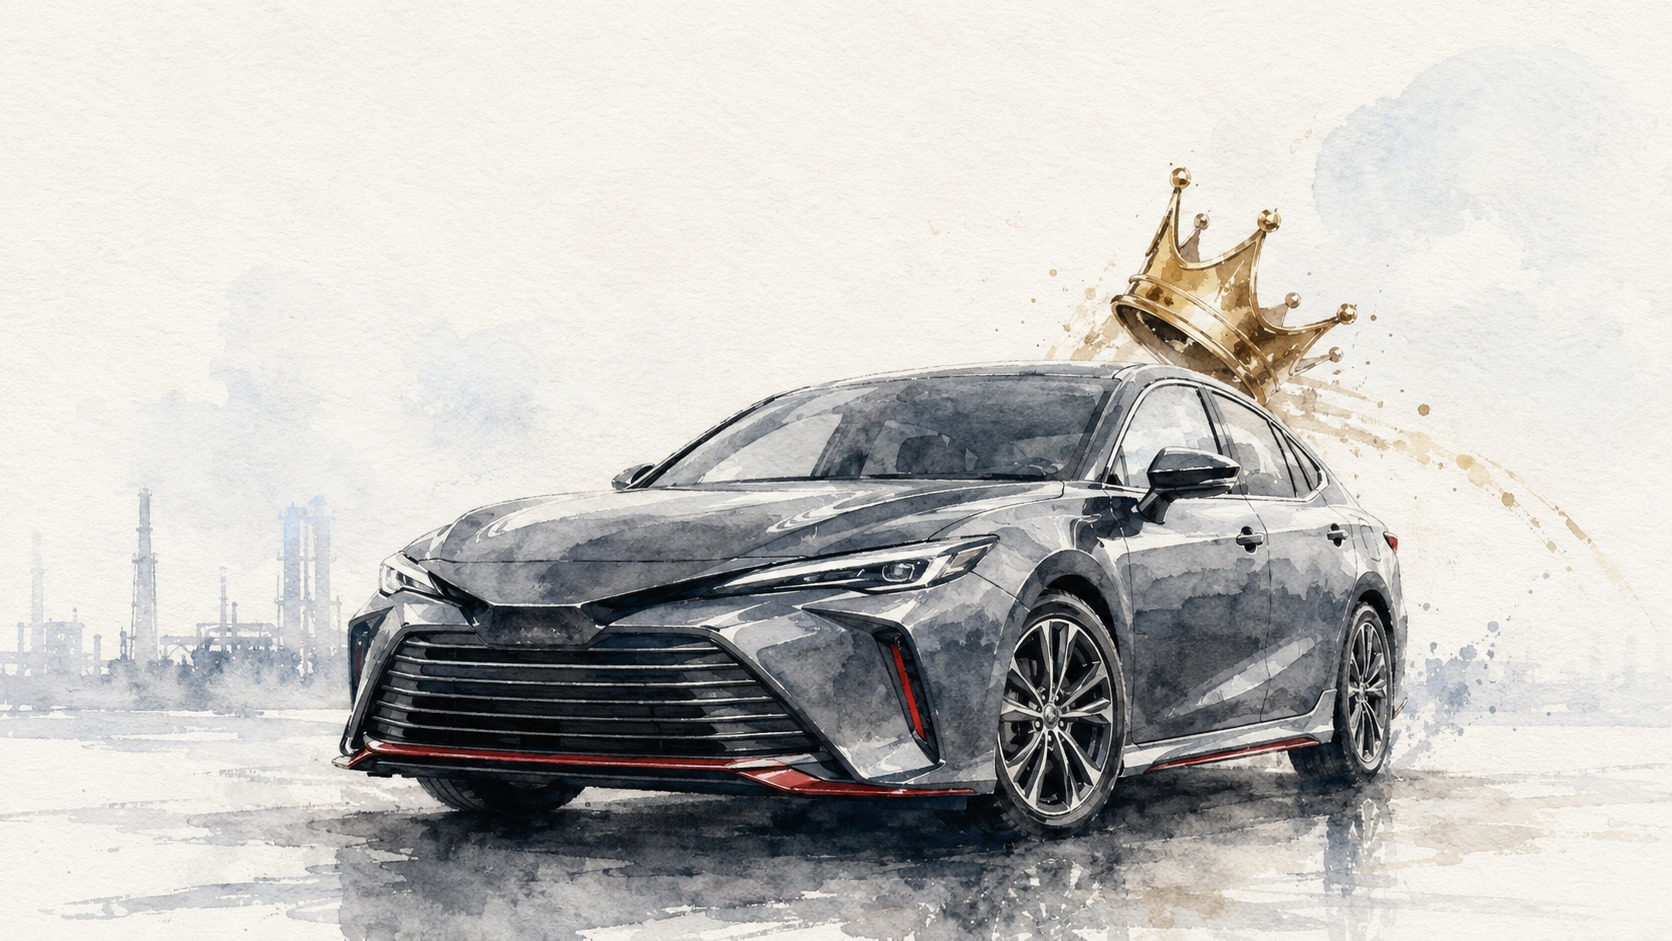
A company can earn ¥3.848 trillion and still be described as having lost its crown. That paradox captures the speed of Japan’s market reordering in 2026. Toyota Motor remains an industrial and cash-generating giant: revenue reached ¥50.685 trillion, consolidated vehicle sales climbed to 9.595 million, and operating cash flow reached ¥5.473 trillion. Yet investors assigned higher future value first to SoftBank’s AI assets and then to MUFG’s interest-rate revival.
On June 1, SoftBank’s capitalization jumped to ¥48.8 trillion, above Toyota’s ¥45.9 trillion. On July 13, MUFG reached roughly ¥42 trillion against Toyota’s approximately ¥41 trillion. Such rankings move with share prices and may reverse. But the interruption of Toyota’s reign—dating from its 2003 displacement of NTT DoCoMo—shows that markets have changed what they regard as Japan’s future.
Record revenue, 19% less profit
Toyota did not shrink in the year ended March 2026. Consolidated sales increased by 232,000 vehicles and revenue rose 5.5%. Pricing, product strength and robust hybrid demand helped. The automotive segment generated ¥45.418 trillion in sales, while financial services expanded to ¥4.857 trillion.
Yet operating income fell 21.5% to ¥3.766 trillion and attributable profit declined 19.2% to ¥3.848 trillion. More vehicles do not automatically create more profit. Tariffs, materials, labor, development, currencies and investment in the production base overwhelmed much of the revenue growth.
A ¥1.38 trillion tax at the border
The largest blow came from additional U.S. tariffs. Toyota disclosed a ¥1.38 trillion reduction in FY2026 operating income. The burden reaches beyond finished vehicles exported from Japan into components, logistics and the economics of North American assembly. It is a policy cost that ordinary productivity improvements cannot simply erase.
The United States is one of Toyota’s largest profit pools. Even after decades of local production, every model and component cannot be contained inside one country. Moving production requires capital and time; leaving it in place incurs tariffs. Passing the cost to buyers can weaken demand, while absorbing it compresses margins.
For FY2027, Toyota forecasts ¥51 trillion in revenue, ¥3 trillion in operating income and ¥3 trillion in attributable profit—a further 22% profit decline. Its assumptions include ¥150 per dollar and ¥180 per euro, alongside uncertainty over geopolitics, commodities and trade.
From looms to automobiles—the first transformation
Toyota’s history is already a story of industrial reinvention. Sakichi Toyoda developed automatic looms, and income from the technology helped his son Kiichiro enter automobiles. Kiichiro studied American and European machinery and carmaking in 1929. Toyota Motor was established in 1937.
After postwar financial distress and the 1950 labor crisis, Toyota refined production without large inventories. “Just in time” supplied what was needed when it was needed; jidoka stopped work when abnormalities threatened quality. Together they became the Toyota Production System and inspired lean manufacturing worldwide.
Oil shocks rewarded Toyota’s small, efficient cars. North American manufacturing expanded from the 1980s. Lexus, launched in 1989, joined quality with luxury margins. The 1997 Prius took the mass-produced hybrid from experiment to global market. Toyota’s distinction has never been size alone; it has repeatedly changed its method at moments of industrial transition.
Why Toyota represented Japan Inc. for 23 years
Toyota overtook NTT DoCoMo in 2003, replacing the symbol of Japan’s mobile-phone revolution as the country’s most valuable listed company. It then endured the global financial crisis, mass recalls, the 2011 earthquake and tsunami, Thai floods, severe yen appreciation, the pandemic and semiconductor shortages while largely preserving its lead.
The crown carried meaning beyond one company. A strong Toyota supported component makers, machine tools, steel, chemicals, logistics, dealers and regional employment. Its valuation was also a price placed on an entire manufacturing ecosystem.
Toyota fell to a net loss in FY2009 during the financial crisis, then recovered. In FY2024 it earned ¥4.945 trillion, then a record for a Japanese company. Losing the market-cap lead just two years later does not indicate collapse. It indicates that the market’s competing valuation framework changed.
The speed advantage of AI and finance
SoftBank’s profit and net asset value can change rapidly when investors reprice OpenAI or Arm. MUFG estimates that a 25-basis-point rise in yen rates can add roughly ¥180 billion to annual net interest income. Both can apply a new market price to enormous existing asset bases at extraordinary speed.
An automaker operates on another clock. A vehicle requires planning, engineering, crash testing, certification, factory tooling, supplier coordination and distribution. Battery plants and software platforms demand years of investment. Millions of vehicles cannot receive an entirely new economic model overnight.
Markets put premiums and discounts on that timing difference. AI attracts high prices for distant growth while manufacturers carry tariffs, fixed assets, inventory, labor and warranties. Speed, however, is not certainty. Private AI valuations can fall and banks can suffer credit cycles. Toyota’s plants, products and customers move slowly, but they are tangible.
The hybrid victory—and the EV question
Toyota’s “multi-pathway” strategy argues that electricity, income, charging infrastructure and resources differ by region, requiring hybrids, plug-in hybrids, battery EVs, fuel cells and combustion vehicles in parallel. Recent hybrid demand has provided powerful commercial validation.
Investors still worry about software-defined vehicles, battery cost and the development speed of Chinese EV makers. BYD uses short cycles and vertical integration to push prices down. Tesla has attracted valuations based on software and autonomy beyond current car profit. The more hybrids protect Toyota’s present, the more closely markets ask whether it can own the next standard in batteries and software.
Toyota is investing in batteries, next-generation BEVs, the Arene vehicle operating system, Woven by Toyota and Woven City. The city is intended as a real-world mobility test course connecting vehicles, people, robots, energy and data. The question is how quickly these efforts can mature into an earnings system comparable in importance to the Toyota Production System.
The quality of ¥3.85 trillion
Toyota’s profit was assembled from nearly 9.6 million vehicle sales, parts, services and finance. It did not chiefly result from marking up one private holding. Operating cash flow of ¥5.473 trillion demonstrates the cash-producing power behind the accounting result.
Manufacturing cash is not costless, however. Factories, tooling, research, inventories, sales finance and quality obligations continually absorb capital. Toyota’s assets reached ¥105.5 trillion and shareholders’ equity approximately ¥41 trillion. That balance sheet provides resilience, but investors demand returns on so much capital. ROE declined from 13.6% to 10.1%.
- Profit is still enormous: Toyota earned more than MUFG in the comparable year.
- Market value prices the future: it is not a ranking of revenue, employment or output.
- Brand value is different: Toyota remained Japan’s most valuable brand in 2026.
- The ranking can reverse: it changes with Toyota, SoftBank and MUFG shares.
Three battles more important than the crown
First, Toyota must treat tariffs as a structural challenge, optimizing local sourcing and production without relying only on price increases. Second, it must preserve its hybrid advantage while shortening development cycles for BEVs and software. Third, it must update the Toyota Production System for a digital era while paying suppliers and workers enough to sustain the ecosystem.
These tasks suppress near-term profit. Refusing to invest would protect ¥3.85 trillion today at the expense of the 2030s. Investing too aggressively could strand capital in factories and technologies customers do not want. Toyota’s traditional strength is not chasing fashion fastest; it is building practical production capacity across several plausible futures.
Without the crown, still a pillar of the economy
The market-cap crossover matters. Capital moving toward AI, chips and finance can diversify Japan’s industrial base. But Toyota’s national impact cannot be measured by one stock ranking. It runs through layers of suppliers, laboratories, factories, ports, dealers, finance companies and hundreds of thousands of jobs.
SoftBank’s AI gains and MUFG’s rate-driven earnings will not by themselves lift Japanese productivity or real wages. That happens when AI improves factories, banks finance productive investment and manufacturers turn new capabilities into goods the world buys.
Toyota in 2026 is not a defeated company. It is an immensely profitable company reminded that past success does not guarantee future valuation. As it once moved from looms to cars, it must now move from automaker toward mobility, energy and software. The answer will matter far more to Japan’s next two decades than the crown it temporarily lost.
Sources and further reading
Market capitalizations move daily. The comparisons in this article refer to the June 1 and July 13, 2026 crossovers reported at the time.
- Toyota: FY2026 financial summary
- Toyota: FY2026 financial-results presentation
- Toyota: Integrated Report 2025
- Toyota: The beginnings
- Toyota: The story behind the Prius
- Woven by Toyota
- Reuters: SoftBank overtakes Toyota
- The Japan Times: MUFG reaches the top market value
- Associated Press: Tariffs and Toyota’s FY2026 results