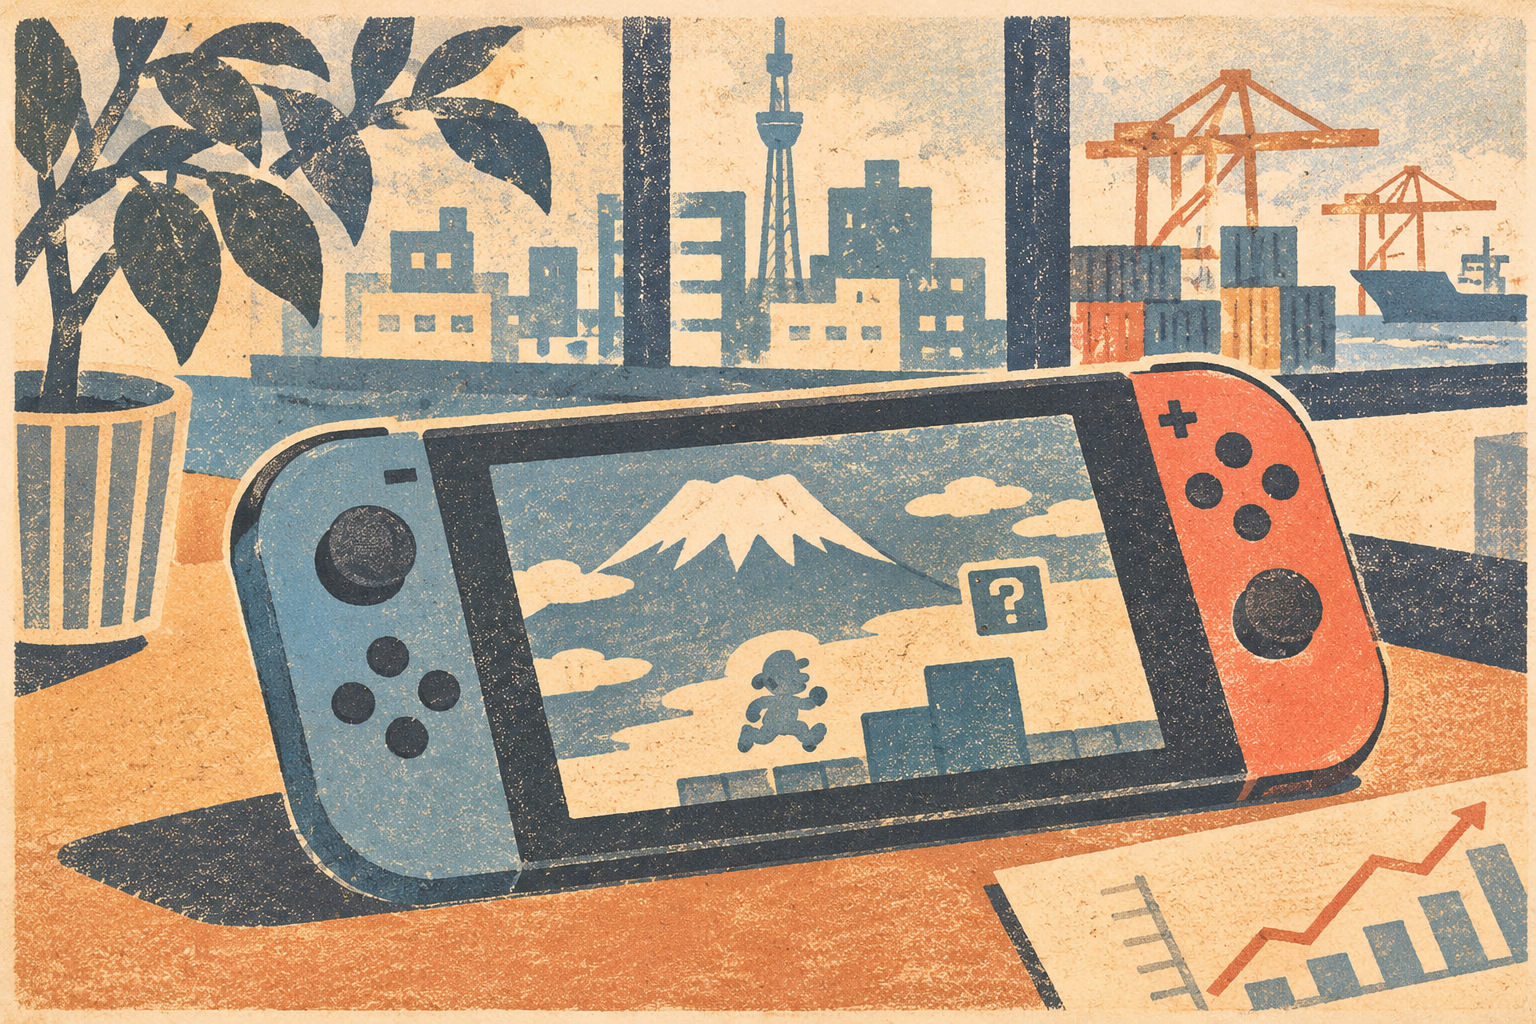
- The console is no longer new. The difficult part begins now
- Two scorecards tell two different stories
- The price of memory meets the price of play
- Why the headline profit increase is not the whole operating story
- Software is where a console’s long-term economics are made
- The question is not how many games, but why anyone comes back
- From playing cards to the handheld-living-room hybrid
- Beyond the cartridge: movies, merchandise and recognizable worlds
- The holiday test and the 16.5-million-unit target
- The second act is an economic test of imagination
The console is no longer new. The difficult part begins now
In the first months after a new Nintendo console launches, the story practically writes itself: queues, shortages, launch titles and an impressive sales total. The harder chapter comes later. Once early adopters have bought the machine, Nintendo must persuade millions more people that the system is worth the price—and that enough original games will keep it worthwhile.
That is the situation facing the Switch 2 as Nintendo heads toward the 2026 holiday season. Its November 5 financial results present an apparent contradiction. For the six months through September, revenue fell 12.1% to ¥966.0 billion, yet operating profit climbed 49.1% to ¥216.5 billion. The machine sold fewer units than a year earlier, while software sales improved. A tariff refund and currency movements also aided the bottom line.
Those results do not mean the Switch 2 has failed. Nintendo reports more than 25 million systems distributed worldwide since the June 2025 launch. Nor do they mean the company's economics are comfortably settled. The question is how a Kyoto manufacturer balances the appeal of a distinctive play experience against the rising price of the electronics required to deliver it.
Two scorecards tell two different stories
The reporting period matters. Nintendo's headline 49.1% increase in operating profit covers April through September 2026, six months. In the three months from July through September alone, operating profit declined about 16% to ¥73.9 billion. Describing the company's entire second calendar quarter as a profit surge would therefore be misleading.
| April–September 2026 | Result / year-on-year change |
|---|---|
| Consolidated revenue | ¥966.0bn / −12.1% |
| Operating profit | ¥216.5bn / +49.1% |
| Switch 2 hardware units | 6.49m / −37.4% |
| Switch 2 software units | 24.49m / +18.8% |
| Digital share of dedicated videogame software revenue | 60.7% |
Source: Nintendo's November 5 financial explanatory material. Unit sales are the company's sell-in measure, which includes shipments to external distribution partners and certain direct sales; they are not identical to consumer sell-through.
President Shuntaro Furukawa said in the November 6 question-and-answer session that a rush to buy before the May Japanese price increase helped produce slower consumer sales afterward. Outside Japan, price adjustments were made in September and the company reported less pronounced differences around the change. Understanding those patterns requires separating sales to channels from purchases by households.
The price of memory meets the price of play
A gaming console is a physical gateway to a digital business. Its processor, memory, storage, display and battery have to be purchased and assembled long before the company earns revenue from future software purchases. When component costs climb, that gateway becomes more expensive to build—even if the consumer sees the same product on a shelf.
Nintendo says its fiscal-year forecast incorporates approximately ¥100 billion in cost pressure related to higher component prices, particularly memory, and tariff payments. Those are broad company planning assumptions, not an independently established measure of how much a single Switch 2 unit became more expensive. Global demand for semiconductors associated with AI infrastructure provides an important industry backdrop, but Nintendo's documents do not isolate a precise AI-driven cost for each component.
At the November 6 briefing, Furukawa described a preference for absorbing manageable increases through production efficiency or Nintendo's own margin. If prolonged cost increases become impossible to absorb while maintaining a healthy business, he said, a price revision must be considered. Japan saw a revision in May; markets outside Japan followed in September. The balancing act is plain: higher prices protect economics but can slow adoption.
Why the headline profit increase is not the whole operating story
Six-month gross margin rose from 36.2% to 50.4%, helped by a richer mix of software revenue. Nintendo also acknowledged a less repeatable boost: a roughly US$300 million refund, recognized in its first fiscal quarter as a reduction in cost of sales, of tariffs previously paid under the US International Emergency Economic Powers Act. The company said it had largely absorbed those tariffs rather than passing them on to customers.
The refund is a real accounting benefit, but not evidence that each new console suddenly became dramatically more profitable. Yen depreciation also contributed an estimated ¥22.2 billion at the operating-profit level. Neither effect should be conflated with underlying demand for games.
Investors therefore need to look beneath the margin: how much comes from consumers buying more games, how much from a transition away from launch-year hardware, and how much from one-off or external circumstances? The six-month number is encouraging but does not erase the weaker July–September quarter.
Software is where a console’s long-term economics are made
Switch 2 software unit sales rose 18.8% year over year to 24.49 million in the half year. Original Switch software also advanced, reaching 65.73 million. That older platform's continuing commercial life matters. An installed base doesn't disappear on the day its successor arrives, and the two generations can support overlapping audiences while developers adapt.
Digital revenue increased 60.5% to ¥249.6 billion, accounting for 60.7% of dedicated game-machine software revenue. The ratio does not mean that 60.7% of individual games were downloaded rather than purchased physically. Nintendo's definition includes digital games, downloadable content and Nintendo Switch Online, and its revenue accounting differs for first- and third-party titles.
Hardware represented 54.5% of dedicated videogame business revenue in the half year, down from 73.2% in the launch-heavy comparative period. A higher contribution from software tends to support margin—but the exact mix will vary with release schedules, game prices and bundles. Nintendo notes that software packed into a console bundle is counted in hardware revenue even though those units appear in game-unit statistics.
The question is not how many games, but why anyone comes back
In its earnings presentation, Nintendo highlighted software including Tomodachi Life: Living the Dream, Rhythm Heaven Groove and Splatoon Raiders. Mario Kart World, released in the previous fiscal year, continued to sell. These titles illustrate both sides of Nintendo's software model: new releases that can pull buyers toward a platform and evergreen experiences that remain commercially relevant.
On November 6, senior executive Yusuke Beppu described Nintendo's development work as its principal source of competitive advantage. That is a revealing answer to a question about longer development cycles. In a marketplace crowded with free entertainment and content delivered through social platforms, Nintendo cannot compete simply by flooding a digital storefront. The games have to provide experiences people cannot readily get elsewhere.
That approach creates risk. Delays can leave gaps in a calendar; a much-anticipated title can underperform; making distinctive games can be more difficult than reproducing an established formula. Yet the software itself provides the logic for Nintendo's hardware business. A technically capable console is only the beginning.
From playing cards to the handheld-living-room hybrid
Nintendo began in Kyoto in 1889 as a playing-card enterprise. Through successive technological changes it became associated with Game & Watch handheld devices, the Famicom in 1983, Game Boy in 1989, Nintendo DS in 2004 and Wii in 2006. Each product had its own hardware features, but the larger question was consistent: how might technology enable a more inviting form of play?
That record also contains misses. Wii U never achieved the mass-market reach of its predecessor. The original Switch, launched in 2017, answered with a simple idea—one device that could move between television and handheld use—and a flow of recognizable games. Its long sales tail offered a powerful demonstration that Nintendo's most durable asset isn't a component specification. It is the bond between familiar characters, inventive mechanics and a machine that makes the experience possible.
Switch 2 inherits that positioning in a very different environment. Hardware component inflation, increasingly sophisticated mobile games and a seemingly endless supply of digital entertainment have narrowed consumers' attention. Nintendo cannot count on brand recognition alone to persuade a buyer to pay a higher price.
Beyond the cartridge: movies, merchandise and recognizable worlds
Nintendo's non-console intellectual-property business is growing as well. The company's category for IP-related income and other revenue rose 87.9% to ¥62.7 billion in April–September. Nintendo cited income related to The Super Mario Galaxy Movie as a contributor. Film, licensing, smartphone activity and official merchandise provide additional ways for a character or game universe to remain visible.
The scale deserves perspective. ¥62.7 billion of IP-related revenue remains far smaller than the company's ¥903.3 billion in dedicated videogame-system revenue during the same period. Nintendo is still primarily a gaming business, not a movie studio with a console division.
A screen adaptation can introduce Mario or Zelda to a generation that has never owned Nintendo hardware. But converting that familiarity into enduring game participation is neither automatic nor easy to measure. Future film projects belong in the column of plans, not realized profits.
The holiday test and the 16.5-million-unit target
Nintendo retained its forecast of 16.5 million Switch 2 hardware units for the fiscal year ending March 2027 and 60 million Switch 2 software units, excluding bundled software under the forecast definition. The company also maintained annual revenue guidance of ¥2.05 trillion and operating profit of ¥370 billion. These are management expectations as of November, not outcomes.
The year-end shopping season will carry disproportionate weight. Nintendo's president told analysts that the weeks ahead would be crucial to achieving the hardware plan. Price changes in important markets make demand harder to extrapolate from earlier in the year, and comparisons against the launch period are inherently uneven.
The metrics to follow are concrete: household purchases after the price increases, inventories in retail channels, new software attachment, component costs and profitability. A temporary sales lull is not necessarily a long-term problem. Nor is a large installed base proof that annual targets will be reached.
The second act is an economic test of imagination
For Nintendo, successful hardware does more than deliver a one-time sale. It creates a place where new games can find audiences, old favorites can endure and friends can play together. If higher component costs force prices too high, the audience may expand more slowly. If prices stay low while costs rise, the console itself becomes a less attractive business.
The half-year results offer reasons for confidence and caution at once. Software sales rose and digital business gained weight. But the profit increase contains a tariff refund and currency effects, while the most recent three-month operating-profit comparison declined.
That is the underlying challenge facing Switch 2 in 2026: to turn a rapid start into a durable cycle of discovery, play and spending. The outcome will be determined less by the excitement of launch day than by the games people still want to play years from now.
Sources and reporting method
Financial figures are drawn from Nintendo’s primary disclosures. Tariff refunds are described as company-reported accounting treatment; future targets and industry interpretations are not presented as realized results.
- 任天堂「2027年3月期 第2四半期決算説明資料」(2026年11月5日)
- 任天堂「2027年3月期 第2四半期決算説明会/経営方針説明会 質疑応答(要旨)」(2026年11月6日)
- 任天堂「2027年3月期 第2四半期決算説明会/経営方針説明会」(2026年11月6日)
- Nintendo — Consolidated Financial Highlights, November 2026
- 任天堂 IR・決算資料一覧
- 任天堂「会社の沿革」
- Nintendo: Tomodachi Life official release
- Nintendo: Rhythm Heaven Groove official release
- Nintendo corporate history