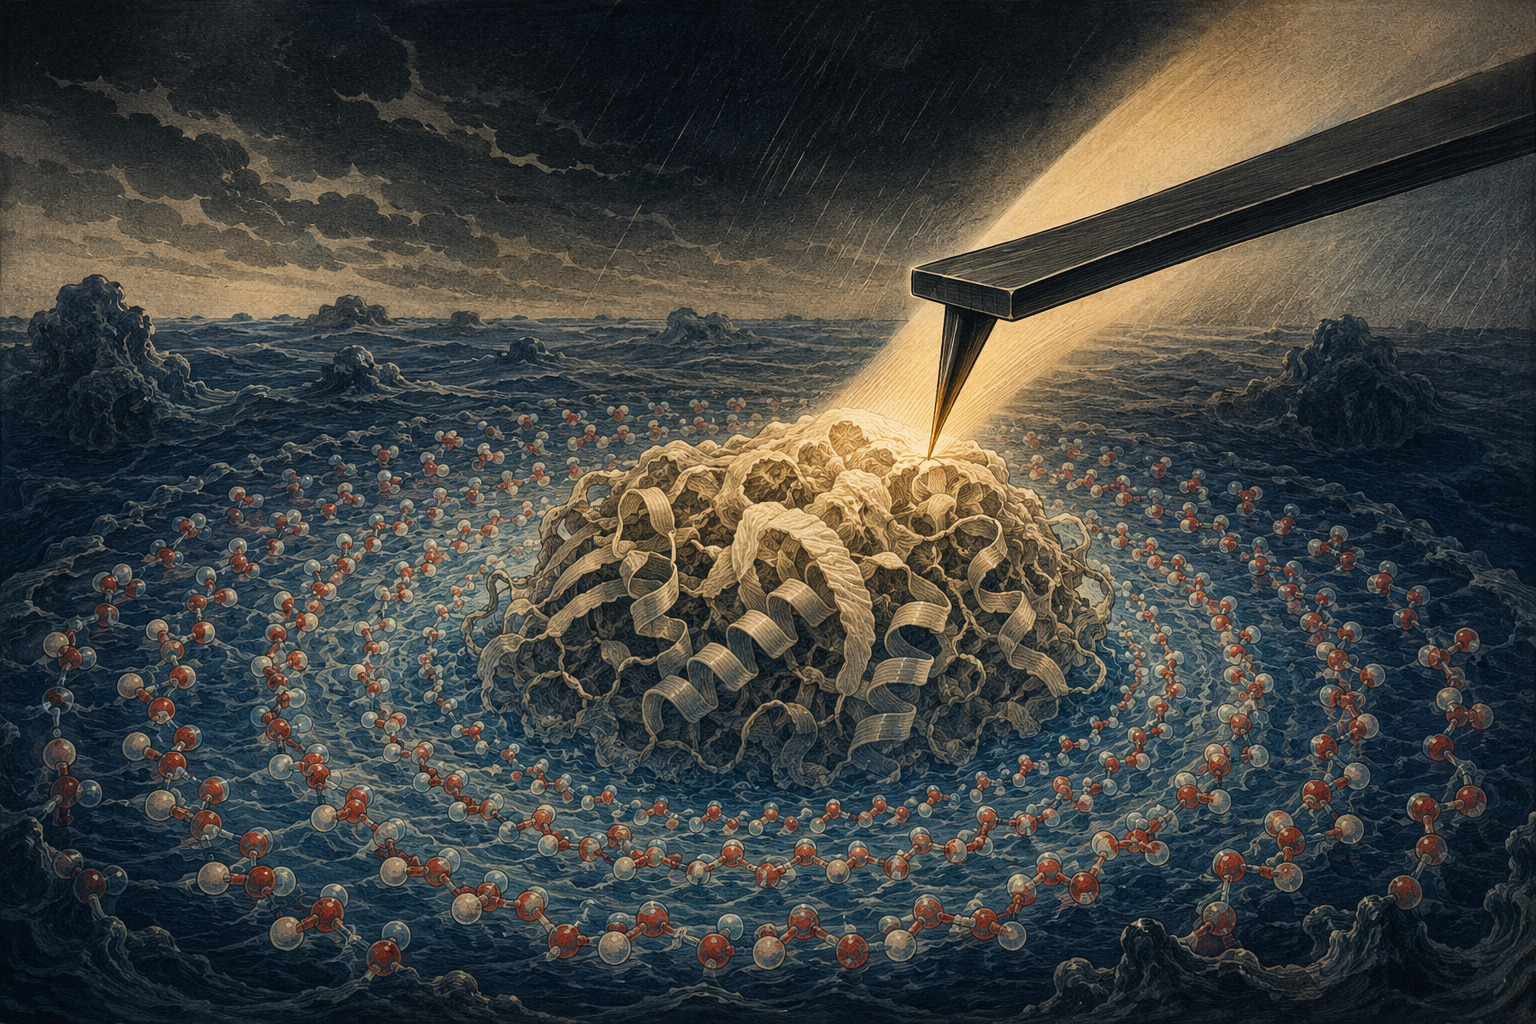
A protein structure is usually presented as if the molecule had been lifted cleanly from its surroundings. The ribbons are colored, the active site is enlarged, and water is removed until the important object becomes legible. The convention is visually useful. It also edits out the medium in which the object folds, moves, recognizes partners and performs chemistry.
A study published online by Nature Communications on August 26, 2026, reverses that editorial choice. Its central object is not the peptide alone but the organization of water above it. Using three-dimensional atomic-force microscopy, or 3D-AFM, an international group led from Kanazawa University’s Nano Life Science Institute mapped a chemically varied hydration zone over an ordered peptide array. Kyoto University contributed through Takashi Sumikama, a program-specific junior associate professor in the Graduate School of Biostudies and collaborating researcher at Kanazawa.
The 12-author paper also names Ayhan Yurtsever, Fabio Priante, Linhao Sun, Djamel Eddine Chafai, Kaito Hirata, Keisuke Miyazawa, Leonardo Puppulin, Kazuki Miyata, Adam S. Foster, Takeshi Fukuma and Mehmet Sarikaya. The work joins experiment in Kanazawa with structure search and molecular simulation across institutions in Japan, Finland, Italy and the United States.
The headline result is easy to overstate. The researchers did not film individual water molecules holding fixed positions around a complete protein. They did not work inside a cell. They stabilized a short, graphite-binding peptide in a repeating lattice on an atomically flat solid, then mapped how a probe’s force response changed in the water above it. That controlled simplification is not a footnote to the result. It is what made the result possible.
A photograph made of resistance
An atomic-force microscope does not need light or an electron beam to render a surface. A sharp tip is attached to a small cantilever. As the tip scans, forces between the tip and its environment alter the cantilever’s behavior. The original AFM, introduced by Gerd Binnig, Calvin Quate and Christoph Gerber in 1986, combined ideas from the scanning tunneling microscope and a stylus profilometer to investigate even insulating surfaces.
Water made the method much harder. Liquid damps a cantilever and introduces noise. High resolution required quieter displacement sensors, controlled frequency modulation and stable, small-amplitude operation. Fukuma and colleagues spent two decades developing those capabilities for liquid environments.
In this experiment, the cantilever oscillated with an amplitude between 0.1 and 0.2 nanometers, smaller than a water molecule. Its tip scanned laterally while the vertical position was modulated sinusoidally at 195.3 hertz. As the tip approached the peptide, it had to displace structured interfacial water. The resulting oscillation in force appeared as a shift in the cantilever frequency, Δf. Recording a Δf value at every position built a three-dimensional volume.
Typical raw datasets contained 128 by 128 lateral pixels and 256 vertical pixels over areas 20 to 30 nanometers wide. The published maps were processed: baseline alignment, slope and height corrections, a three-by-three averaging filter and, in some cases, linear interpolation. Force was derived from the frequency signal for quantitative profiles.
“Direct visualization” therefore has a technical meaning. The instrument directly sampled a local force response in real space rather than inferring one global hydration shell from an ensemble measurement. The colored water maps are still reconstructed, processed observables. They represent time-averaged density variations in a rapidly rearranging hydrogen-bond network, convolved with the hydration and chemistry of the probe itself.
The deliberate compromise beneath the water
The difficult experimental choice was not merely how to scan. It was what to scan. A protein offers the biological reality everyone wants and almost none of the stability needed for this measurement. Its side chains move, its domains breathe, and both structure and hydration are averaged during acquisition. Immobilization can help, but a large heterogeneous surface still fluctuates.
GrBP5-WT is a bottom-up answer. The dodecapeptide was selected for affinity to graphite and forms long-range, ordered two-dimensional crystals on highly oriented pyrolytic graphite, or HOPG. The observed oblique unit cell measured approximately 3.2 by 1.6 nanometers with an angle near 72 degrees. Repetition provides a signal that can survive averaging, while the atomically flat substrate limits geometric uncertainty.
The sequence packs several kinds of protein-like surface chemistry into a tiny system. IMVT forms a hydrophobic region. ESSD includes polar and negatively charged residues. Tyrosines supply aromatic groups that can stack against the graphene lattice. In the model selected by the authors, tyrosine lies relatively flat on the carbon surface while methionine protrudes into the water. The result is not chemically featureless even though it is structurally simple.
That simplicity purchases resolution by suppressing biology. The graphite alters peptide conformation. The repeated lattice is more orderly than a typical exposed protein surface. Large conformational changes are restrained by adsorption. Molecular crowding, membranes, metabolites and the fluctuating ionic conditions of a cell are absent. The model can isolate whether local chemistry organizes water; it cannot establish the duration or functional consequence of the same patterns in vivo.
From a blanket to a fingerprint
Bare graphite and peptide-covered graphite could be compared in the same scan. Above bare HOPG, water mainly showed vertical layering with little lateral molecular organization. Above the peptide crystal, the map contained patterns aligned with the peptide lattice. Those patterns changed rather than simply fading: features weakened, disappeared and sometimes reappeared at successive heights before correlations relaxed toward bulk-water behavior.
Representative Δf-versus-distance profiles placed the interfacial water column at 1.35 ± 0.07 nanometers—roughly three to four water molecular diameters. A separate correlation analysis retained a diffuse but statistically detectable third shell near 1.25 to 1.30 nanometers. Past that range, the profile approached minor bulk-like fluctuations.
The researchers did not rely on a single probe surface. Hydrophilic silicon and hydrophobic amorphous-carbon tips produced different contrast and force-response characteristics, as expected, but preserved the central multilayer organization. That comparison argues that the structure belongs to the interface rather than being manufactured entirely by the tip. It cannot remove tip convolution: the tip has its own water layer, and pressing through one hydration structure with another is part of the signal.
Phosphate-buffered saline added another test. The peptide lattice remained, but the hydration pattern reorganized. The paper associates some of that change with sodium and potassium interactions at acidic aspartate and glutamate residues. In PBS, the first measured spacing was 0.32 ± 0.03 nanometers across 33 observations; a broader 0.37 ± 0.05-nanometer spacing, based on 21 observations, was attributed to more heterogeneous surface heights, exposure and thermal motion.
The important word is local. Hydrophobic, polar, aromatic and charged regions did not wear one uniform water coat. They created distinguishable density patterns across layers. The authors call these patterns sequence-dependent hydration fingerprints. The phrase captures the finding while avoiding a stronger claim that any particular water molecule remains attached as a permanent structural component.
Simulation supplied the atom names
A force map can locate repeated features without identifying every atomic cause. To interpret the maps, the group first built a neural-network potential from 1,156 density-functional-theory structures. It then generated 10,000 side-chain rotamers—2,000 parallel two-peptide arrangements and 8,000 antiparallel ones—and searched for cells compatible with the measured lattice.
The final candidate was not chosen by energy alone. It matched the experimental unit-cell dimensions and was judged visually similar to the high-resolution AFM pattern. A six-by-five supercell of that candidate was placed in water for a classical molecular-dynamics calculation containing 281,082 atoms. The peptide and graphite were harmonically restrained while water moved. Five nanoseconds of equilibration preceded a 10-nanosecond production run.
The simulated oxygen density produced arches, branches and hydrogen-bond motifs resembling features in the experimental sections. It also provided a molecular account of why methionine exposure, acidic residues and aromatic binding zones created different hydration. An explicit model of the AFM tip at 18 positions tested how the measurement itself altered free-energy profiles.
These calculations strengthen a chemically specific explanation. They are not an independent photograph confirming it. The candidate structure was partly selected because it resembled the measured pattern; the peptide was restrained; finite trajectories sample only a fraction of conformational space; and results depended on the water model. Standard TIP3P water underestimated order beyond the first shell. The four-point OPC model restored a stronger second shell and agreed more closely with the AFM range.
- Observed: a periodic three-dimensional Δf distribution above the peptide, with correlations decaying across approximately three to four hydration layers.
- Interpreted: probe controls, PBS measurements, spatial statistics and simulations connect those patterns to local water density and peptide chemistry.
- Proposed: that comparable hydration architecture should be treated as part of protein structure and may improve functional prediction or molecular design.
A long road from mica to biomolecules
The new paper arrives late in a history of interfacial water imaging, not at its beginning. In 2005, Fukuma and colleagues reported true atomic resolution with frequency-modulation AFM in liquid. In January 2010, they described atomic-scale three-dimensional water distributions at a mica–water interface in under a minute. A second 2010 study involving Kyoto University researchers visualized site-specific hydration at mica and more densely packed layers at a biomolecular surface.
The field then moved from regular minerals toward less obedient biological interfaces. Three-dimensional scanning force microscopy resolved lipid headgroups and water at a membrane interface in 2012. A 2017 Kyoto University study combined 3D force mapping and simulation to distinguish water distributions over oppositely charged clinochlore surfaces. DNA hydration and nanoscale surface chains followed.
A particularly relevant precedent appeared in 2022. Shinichiro Ido and colleagues used AFM to resolve ordered water on bacteriorhodopsin, localized near proton-uptake channels on the cytoplasmic surface. That was structured water on a membrane protein, years before the present peptide study.
In April 2026, Sumikama, Yurtsever and collaborators published a different bridge between hydration and function. They mapped three-dimensional hydration around membrane-bound annexin V assemblies and used molecular dynamics to calculate an energy landscape in which water at three junctions acted like a lubricant, enabling rotational flexibility. The annexin work studied a real protein and a proposed mechanical consequence; the August paper gains finer, multilayer sequence specificity by returning to a more rigid model.
1986 Atomic-force microscopy is introduced.
2005 Fukuma and colleagues report true atomic resolution in liquid FM-AFM.
2010 Atomic-scale three-dimensional water distribution is mapped at mica–water interfaces.
2012–2018 Hydration mapping expands to lipid membranes, charged minerals and DNA.
2022 Ordered water is resolved on the membrane protein bacteriorhodopsin.
April 2026 Annexin V hydration is connected computationally to rotational flexibility.
August 2026 Multilayer, residue-linked hydration is mapped over an ordered peptide model.
Where the “world first” begins—and ends
Kyoto and Kanazawa universities promoted the study as the world’s first visualization of the hidden water structure that determines protein function. The institutional release is broader than the defensible novelty. Hydration layers, biomolecular hydration and even ordered water on a membrane protein had already been imaged. The new paper itself acknowledges earlier 3D-AFM work on DNA and defines its extension more carefully.
The narrower advance is substantial: a molecularly ordered peptide platform allowed the team to resolve hydration patterns associated with different residue domains and follow their spatial evolution through several water layers. The authors combined that map with quantitative correlation analysis and simulations detailed enough to propose local hydrogen-bond motifs.
Two substitutions are therefore required in responsible reporting. Peptide model should replace protein when describing the specimen. Multilayer, residue-linked architecture should replace an unqualified claim that water around biological molecules was seen for the first time. Precision does not diminish the experiment; it identifies what future work must reproduce.
A useful idea with an ambitious name
The authors call their integrated picture of an amino-acid framework plus its sequence-specific hydration zone a “protein superstructure.” The term makes a strategic demand on protein science: do not stop at the dry molecular surface. Predict the spatial and energetic organization of water that the surface creates.
That demand is plausible. A ligand entering a binding pocket may displace unfavorable water, preserve a bridging molecule or reorganize a network. One residue substitution can alter charge, hydrophobicity and hydrogen-bond capacity without dramatically changing the visible fold. An explicit hydration map could therefore provide information that a shape-only comparison misses. It could also give protein-design and drug-binding simulations an experimental benchmark instead of allowing each water model to produce an untested answer.
But “protein superstructure” is the authors’ proposed framework, not established consensus terminology. The experiment did not measure binding affinity, catalysis, folding rate or drug action. It did not demonstrate that adding hydration maps improves an AI model. Those are research directions. Calling them applications already delivered would turn a testable concept into branding.
The next image has to move
The paper’s discussion is notably explicit about what the beautiful layers do not mean. In living systems, thermal motion, conformational rearrangement and molecular crowding rapidly reduce long-range spatial coherence. The authors say the findings should not be interpreted as biologically persistent long-range water ordering. The transferable idea is a local, chemically encoded hydration signature that may survive within a fluctuating environment.
Current 3D-AFM offers extraordinary spatial detail at a cost in time. Kanazawa’s instrument overview gives a typical acquisition rate of roughly one minute per frame, while the water network and many protein motions operate vastly faster. The field still lacks enough combined spatial and temporal resolution to watch hydration fluctuations couple directly to protein conformational change. Long-range communication, cooperative binding and ligand–receptor effects remain open questions identified by the authors themselves.
The next decisive experiment will be messier than this one. It will need a full protein that moves, a biologically relevant environment, a way to follow water and conformation together, and an independent functional readout. It may produce a blurrier image. It would answer the more important question: whether a hydration fingerprint predicts what the molecule does.
For now, the 12-residue lattice has performed a valuable act of scientific staging. It held the molecular surface still long enough for the surrounding water to become visible as an experimental variable. The map is not yet a portrait of life. It is evidence that the blank space around the portrait contains structure worth measuring.
- Kyoto University — Research announcement, August 27, 2026
- Kanazawa and Kyoto universities — Joint Japanese release, figures and terminology
- Nature Communications — Yurtsever et al., sequence-specific multilayer hydration, 2026 (DOI: 10.1038/s41467-026-76923-4)
- Kyoto University Graduate School of Biostudies — Annexin V hydration and rotational flexibility, April 2026
- Physical Review Letters — Original atomic-force microscope paper, 1986
- Physical Review Letters — Three-dimensional water distribution at mica, 2010
- Journal of Chemical Physics — Local hydration visualization by AFM, 2010
- Kyoto University — Water distributions at charged solid–liquid interfaces, 2017
- Nano Letters — Structured water on membrane proteins, 2022
- Kanazawa University WPI-NanoLSI — Liquid FM-AFM and 3D-AFM capabilities