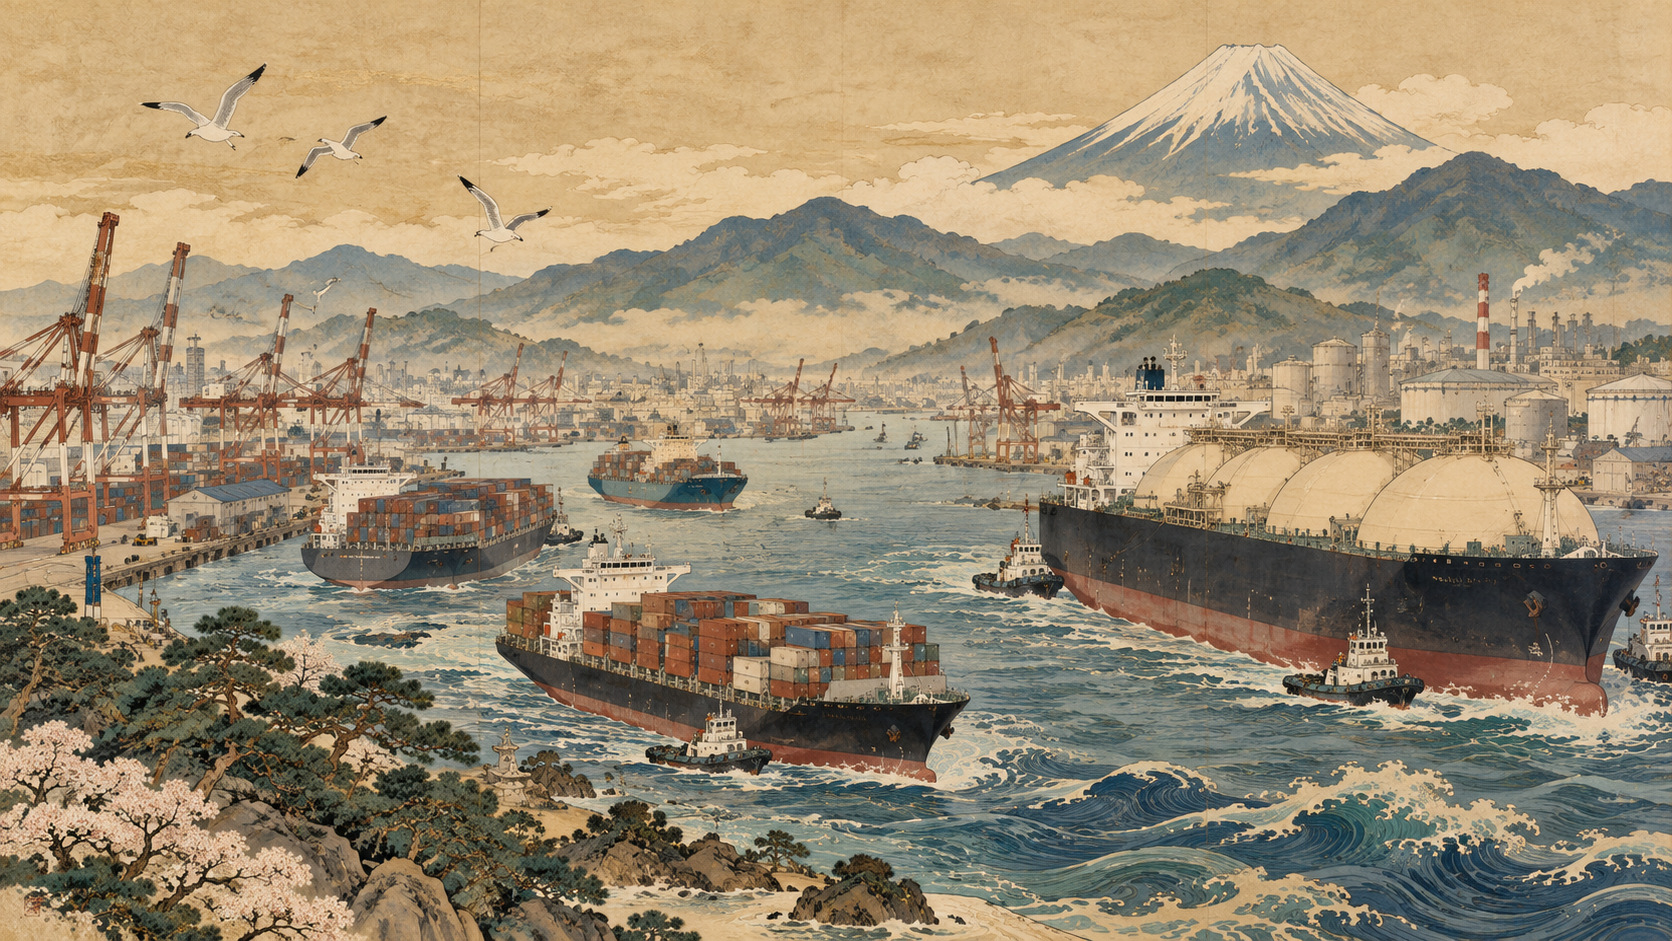
A record-breaking export machine—and a deficit
If the familiar image of Japan is a country earning its living by selling cars, machinery and electronics abroad, the newest trade numbers seem to confirm it. Yet the same figures expose a different dependency: the cost of everything Japan must import to keep that export machine, and the rest of the economy, running.
In its October 21 preliminary release, the Ministry of Finance put merchandise exports for April–September 2026 at ¥63.45695 trillion, up 18.4% from a year earlier. Imports reached ¥66.275384 trillion, up 20.4%. Both were record highs for a fiscal first half in the comparable series dating to 1979. The difference was a ¥2.818434 trillion deficit, nearly double the previous year’s and the eleventh consecutive fiscal half-year in the red.
The hidden story: prices versus physical volumes
The most revealing contrast is between the value of trade and the amount of merchandise moved. Japan’s export volume index rose just 2.3% while export value jumped 18.4%. Import volumes fell 1.1%, even as import value climbed 20.4%. Japan did not simply import 20% more physical goods.
Those divergent indices point to prices, product mix and exchange-rate effects. They do not by themselves yield a precise decomposition of how much of the deficit resulted from each. A more expensive shipment can raise a customs import bill without adding a single extra barrel or container. Equally, a weaker yen can increase the reported yen value of foreign-currency receipts as well as obligations.
Oil matters. So do chips and metals
The largest year-on-year value gains included imported semiconductor and electronic components, up 63.2%; crude oil, up 26.3%; and nonferrous metals, up 55.2%. News coverage correctly stresses the energy shock linked to Middle East conflict, but the official product breakdown warns against treating oil as the only explanation.
On the export side, semiconductor and electronic components climbed 50.8%, automobiles 15.2%, and semiconductor manufacturing equipment 26.5%. Japan can be both a major chip-industry exporter and a buyer of chips. Materials, equipment, designs and finished products cross borders at different stages. The same supply chain can produce growth in both sides of the ledger.
A maritime chokepoint becomes a domestic cost
Japan’s exposure to oil prices is not abstract. Imported fuel runs through electricity generation, transport, petrochemicals and countless production processes. Freight contracts, inventory and hedges determine how quickly a shock reaches retail shelves and utility bills. Associated Press reporting has linked the rise in Japan’s energy-import costs to the Iran conflict and the resulting disruption and rerouting of some crude flows.
A benchmark crude price, however, is not the same as the customs price paid on every Japanese shipment. Grades, freight charges, contractual lags and the exchange rate all matter. Nor can a single half-year trade release establish precisely what proportion of the deficit is attributable to a particular transport restriction. That requires additional shipment-level evidence.
The yen acts as both cushion and amplifier
The Ministry of Finance reported an average customs exchange rate of ¥159.54 per U.S. dollar for the half-year, compared with ¥146.1 a year earlier—a 9.2% depreciation. Foreign-currency export revenue can translate into more yen, potentially helping exporters. Imported fuel and materials, meanwhile, cost more in yen before businesses even consider what they can pass along.
The gains and losses are not distributed evenly. Companies with large offshore sales and local production may be affected differently from domestic restaurants, transport operators or small manufacturers reliant on imported inputs. Households care less about the national export record than about real wages and the price of electricity, food, and commuting.
America, China and the regional balance
Japan still recorded a surplus with the United States: ¥2.122434 trillion. But it was down 35.1% year on year as imports from the U.S. rose 43.9%, faster than exports to the U.S. at 17.2%. Against China, the deficit reached ¥4.6007 trillion as Japan imported substantially more than it exported.
Asia as a whole remained in surplus for Japan at ¥1.389651 trillion, though that surplus narrowed by 44.1%. These figures illuminate the geography of trade, not a scorecard of national virtue. They also caution against simplistic claims that one trading partner or one commodity explains the entire national result.
A century of industrial strength and energy exposure
Japan’s postwar industrial rise rested on importing fuel and raw materials, processing them through sophisticated factories, and exporting higher-value products. The oil shocks of the 1970s exposed the fragility of the model and accelerated conservation and fuel diversification. Following the March 2011 earthquake and nuclear accident, changes in the electricity supply mix deepened fossil-fuel import requirements for a time. Global energy inflation and a weaker yen again swelled import bills in 2022.
The economy of 2026 is not the economy of 1973 or 2011. Japanese firms have vast overseas production and investment networks, and high-value manufacturing is shared across Asia and North America. Still, the repeated lesson is striking: a technologically sophisticated exporter can remain acutely vulnerable to the cost and security of imported energy.
Why a trade deficit is not a national loss statement
A merchandise trade deficit is the value of imported goods minus exported goods. It is not the same as the current-account balance, which also includes services and income from overseas investments. Japan’s sizable foreign asset holdings make that distinction especially important.
Nor is every import a sign of weakness. A machine or chip imported for productive investment can contribute to future output. Conversely, rising nominal exports do not automatically imply equally strong growth in physical volume or domestic incomes. Policymakers and investors should examine real quantities, prices, value added and returns, not just the headline balance.
The tests ahead
Japan has options, but none is cost-free: diversifying energy supplies, raising efficiency, upgrading electricity networks, developing low-carbon supply, and debating nuclear generation under safety and community constraints. Short-term consumer relief can blunt an immediate shock but cannot erase exposure to world prices.
The next set of figures should be read alongside the customs exchange rate, trade volumes, energy import values, semiconductor supply chains, wages and the broader current account. The central question is not whether Japan can sell more. It plainly can. The question is how much of the value it creates can withstand the rising cost of what it has to buy.
Sources and methodology
Principal figures are from the Ministry of Finance October 21, 2026 preliminary customs-based April–September release. Subsequent revisions may change these numbers.