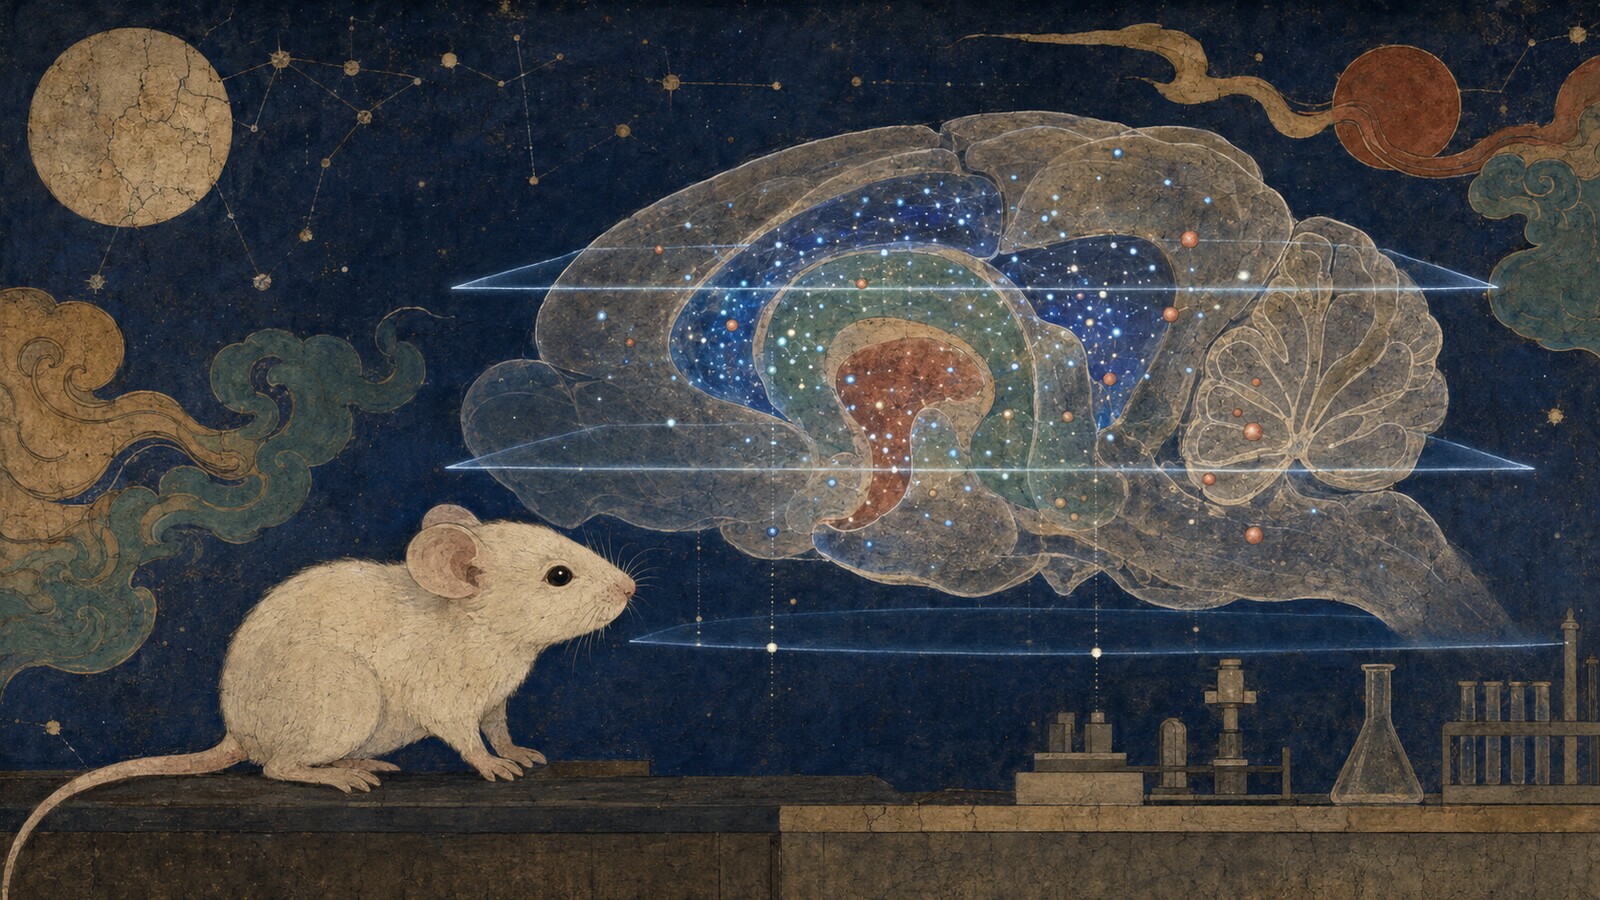
The brain on the microscope stage no longer looked like a brain. After immersion in a clearing solution, the newborn mouse organ had become a pale, almost glasslike volume. A thin plane of laser light entered from the side. As the instrument advanced through the tissue, point after point of fluorescence emerged from the dark—then software assembled the optical slices into a rotating map.
The visual grammar resembles a night sky: anatomy becomes space, signal becomes stars. In the three-dimensional reconstruction, the smallest test particles appeared widely across the neonatal brain. The researchers measured relatively stronger light in the thalamus and brainstem than in the cerebral cortex or cerebellum. Because the brighter regions lie near the ventricular system, the pattern raises questions about cerebrospinal fluid, entry and clearance. It does not answer them.
That distinction is the center of the study published online June 29 in Journal of Hazardous Materials Advances. Yang Mi and colleagues at Japan’s National Institute for Environmental Studies, the University of Osaka and Waseda University developed an imaging workflow: oral exposure, whole-organ fluorescence screening, optical clearing, light-sheet microscopy, regional quantification and a spectral check on the identity of the signal.
The achievement is not “plastic proved to damage babies’ brains.” It is a new way to ask where model particles go inside one of biology’s most difficult organs without reducing that organ to a handful of slices. The map turns an invisible distribution problem into an anatomical question. It also reveals how many steps remain before distribution can become dose, mechanism, injury and finally human risk.
What the Japanese team actually did
The researchers began with pups on postnatal day zero, the day of birth. They administered 30 microliters of distilled water or fluorescent polystyrene particles by mouth. An initial 50-nanometer dose comparison used concentrations of 2.5 and 12.5 milligrams per milliliter. For the central size comparison, the team used the higher concentration with spherical particles nominally 50 or 500 nanometers across. Thirty microliters at 12.5 milligrams per milliliter contains 375 micrograms of material.
One day later, they screened intestine, liver, kidney and brain with fluorescence stereomicroscopy. The 50-nanometer material gave conspicuously stronger signals than the 500-nanometer material, especially in intestine and brain. The larger particles were weak across the organs examined. This is a distribution pattern under an intentionally conspicuous experimental exposure, not a measurement of what a mouse—or a child—ordinarily consumes.
For the brain, the team compared three clearing methods, then selected SeeDB2G because it made the neonatal organ transparent while preserving the fluorescent label. Light-sheet fluorescence microscopy captured the intact volume. Software stitched and rendered the image stack, then investigators measured mean fluorescence in four anatomical regions: cerebral cortex, thalamus, brainstem and cerebellum.
The thalamus and brainstem registered the strongest relative signals after exposure to 50-nanometer particles. The research team separately used hyperspectral imaging, which records a light spectrum at each image position, to check that detected signals matched the spectral signature of the labeled polystyrene rather than free dye or the tissue’s own autofluorescence. That validation strengthens the observation. It still does not convert brightness into an exact particle mass or count.
| Question | What the study did | What it did not establish |
|---|---|---|
| Does particle size alter distribution? | Compared equal mass concentrations of nominally 50 nm and 500 nm fluorescent polystyrene spheres after oral administration | How irregular, weathered environmental mixtures of different polymers behave |
| Where is the brain signal? | Rendered whole neonatal brains transparent and compared fluorescence in cortex, thalamus, brainstem and cerebellum | An absolute particle count, intracellular location or a proven route across a specific barrier |
| Is the fluorescence plausible? | Used hyperspectral analysis as an independent spectral check against free dye and autofluorescence | Polymer-specific chemical quantification of every fluorescent voxel in the whole brain |
| Did exposure cause harm? | Designed a proof-of-concept biodistribution workflow | Neurotoxicity, developmental impairment, behavior change or human health risk |
The map is relative, not a particle census
Fluorescence is seductive because it looks countable. A brighter region seems to contain “more plastic.” The study supports that comparison within its experiment, but light intensity is not the same thing as a certified number of particles. Brightness can depend on local particle concentration, dye loading, optical depth, tissue chemistry, clearing, aggregation, instrument settings and how regions are drawn.
The paper therefore reports relative fluorescence. It does not say that the thalamus contained a given number of spheres per gram, or that a defined percentage of the swallowed dose entered the brain. It also does not resolve whether every signal sat inside a neuron, a glial cell, a vessel, a perivascular space or cerebrospinal fluid. Whole-organ context answers one scale of question while leaving the cellular scale open.
There is another geometrical wrinkle. A 500-nanometer sphere has ten times the diameter of a 50-nanometer sphere. Its volume—and, for the same material, its mass—is about 1,000 times greater. At equal mass concentration, the small-particle suspension therefore contains on the order of 1,000 times as many ideal spheres and roughly ten times their combined surface area. The experiment shows a strong size-associated distribution difference, but “size” arrives bundled with particle number and total interface available to contact proteins, membranes and mucus.
That is not a flaw hidden by arithmetic; it is part of nanotoxicology. Biology responds not only to grams but to objects and surfaces. A good follow-up would compare equal mass, equal particle number and perhaps equal surface area, then characterize aggregation in relevant fluids. Each comparison answers a different question.
How to make a brain disappear
Ordinary brain tissue is opaque not because it is uniformly dark but because its components bend and scatter light in different directions. Water, lipids, proteins and cellular membranes have mismatched refractive indices. A photon entering the tissue repeatedly changes course; fine structure disappears into haze.
Tissue clearing reduces that mismatch. SeeDB2G is an immersion-based method built around iohexol, a dense, water-soluble compound also used in medical contrast media, with saponin to aid penetration. Its refractive index is tuned for glycerol-immersion optics. The method preserves fluorescent proteins and dyes comparatively well and avoids the dramatic shrinkage or expansion produced by some other protocols.
The lineage matters. In 2013, Meng-Tsen Ke, Satoshi Fujimoto and Takeshi Imai introduced the original SeeDB, a fructose-based clearing method designed to maintain neuronal morphology. In 2016, Ke and colleagues reported SeeDB2, optimized to reduce optical aberration for high-numerical-aperture lenses. SeeDB2G, the lower-viscosity variant used here, could accommodate larger tissue and retain fluorescence long enough for volumetric imaging.
Japan has been unusually influential in this transparent-organ revolution. Scale, CUBIC and SeeDB grew from Japanese laboratories, each solving a different compromise among speed, molecular preservation, deformation, staining and optical access. They helped transform anatomy from a discipline of selected sections into one capable of surveying intact organs.
Clearing is nevertheless processing. The brain in the image is fixed and chemically altered, not alive and not being watched as particles move. The beautiful three-dimensional volume is a reconstruction of retained signal after preparation. To infer transport, investigators will need multiple time points, vascular and ventricular markers, cell-type labels and ideally complementary chemical measurements.
A sheet of light instead of a knife
Classical histology earns detail by cutting tissue thin. A microtome produces sections that can be stained and examined at high resolution, but every cut removes continuity. Sampling ten or twenty planes from a brain risks missing a sparse or uneven distribution. Aligning many sections into a faithful volume becomes its own technical project.
Light-sheet microscopy takes the opposite bargain. A laser is shaped into a thin sheet that illuminates one optical plane from the side while a camera observes at a right angle. Move the cleared specimen through the sheet—or the sheet through the specimen—and the instrument records a rapid stack with less out-of-focus excitation than conventional wide-field imaging.
The optical idea reaches back to Richard Zsigmondy and Henry Siedentopf’s early-twentieth-century ultramicroscope, which illuminated colloids from the side. In 2004, Jan Huisken and colleagues at the European Molecular Biology Laboratory introduced selective plane illumination microscopy for deep imaging of living embryos. Combined with twenty-first-century tissue clearing and computing, the sheet of light became a practical tool for mapping entire mouse brains.
For nanoplastics, the value is coverage rather than a miraculous ability to see a 50-nanometer sphere as a crisp bead. The microscope detects fluorescent signal associated with the test material across a millimeter-scale organ. The “nanoplastic map” is therefore a mesoscopic distribution image, not electron microscopy of every individual nanoparticle.
Size behaves like a biological passport
A particle’s diameter helps determine almost every border it meets. Mucus can trap it. Intestinal epithelial cells may take it up or exclude it. Proteins adsorb to its surface and form a biological corona that changes what cells recognize. Macrophages may engulf it. Kidneys may filter some nanoscale materials while retaining others. Aggregation can turn nominally small spheres into larger traveling units.
Smaller does not automatically mean more toxic. It means a different combination of mobility, number, surface curvature and reactivity. A 50-nanometer sphere can encounter membranes differently from a 500-nanometer sphere, but surface charge, polymer, stabilizers and the adsorbed corona may outweigh nominal diameter. Weathered fragments from a tire or food package are not smooth laboratory polystyrene.
Even the vocabulary shifts under the microscope. The U.S. Environmental Protection Agency calls particles below one micrometer nanoplastics, a convention that includes both sizes in this study. Some regulatory nanomaterial definitions focus on one to 100 nanometers; under that narrower usage, the 500-nanometer material is submicron plastic rather than “nano.” The disagreement is not merely semantic. Definitions determine which instruments, standards and regulations apply.
The tempting route—and the route not proved
The thalamus sits around the third ventricle; the brainstem borders the ventricular and cerebrospinal-fluid pathways farther caudally. Their stronger fluorescence makes a CSF-related route biologically plausible. The pattern might reflect entry near a blood–CSF interface, movement with ventricular fluid, tissue retention or slower clearance. The authors present these as hypotheses, not conclusions.
A common headline would say the particles “crossed the blood–brain barrier.” The experiment did not directly demonstrate that crossing. A brain signal after oral dosing requires a sequence—intestinal uptake, systemic transport and arrival in or around brain tissue—but the imaging did not watch that sequence or identify the exact barrier. It did not establish whether signal was intravascular or extravascular at cellular resolution.
The developing brain also should not be described as simply unprotected. For much of the twentieth century, textbooks repeated that fetal and newborn blood–brain barriers were immature or leaky. Modern developmental-barrier research shows functional tight junctions and regulated transport early in embryonic life. Developing interfaces differ from adult ones, and some transport systems are especially active, but “different” is not “absent.”
That matters because the study itself uses the careful phrase “developmental characteristics of barrier systems.” A mechanistic experiment could label blood vessels, choroid plexus and ependyma, perfuse away circulating particles, resolve particles against specific cell types and sample blood and CSF over time. Until then, the brightest region is an address, not a travel diary.
A newborn mouse is not a human infant
Birth is a dramatic event in both species, but it is not a universal developmental timestamp. Mice are born after roughly three weeks of gestation with many neural systems continuing rapid postnatal maturation. Human brain development follows a much longer timetable, and different circuits align across species at different ages. There is no single conversion in which mouse postnatal day zero equals a particular week of human pregnancy or day of infancy.
The model remains valuable precisely because its developing organs and barrier systems can be studied experimentally at a defined stage. It can reveal whether a particle property changes distribution and help prioritize mechanisms. It cannot estimate a human infant’s brain dose from food, water, air, formula or breast milk.
The exposure is equally important. The paper calls it a high-dose proof-of-concept model chosen to produce robust whole-organ fluorescence. The spheres were monodisperse polystyrene with a fluorescent label; real-world particles are mixtures of polyethylene, polypropylene, polyester, tire-wear rubber, paint and many other polymers, with irregular shapes, additives, weathering and biological coatings. One bolus delivered directly by mouth differs from chronic, low-level exposure through diet and dust.
Nor did the investigators measure learning, motor development, inflammation, cell death or altered brain structure. Detection establishes presence under the test condition. Toxicity requires evidence that the presence changed biology adversely, with attention to dose and reversibility. Risk requires both hazard and realistic exposure.
- From fluorescent mouse-brain signal to an amount of plastic in a human newborn’s brain.
- From one 375-microgram model dose to ordinary daily exposure.
- From smooth polystyrene spheres to the full mixture of environmental fragments and fibers.
- From distribution at 24 hours to persistence, accumulation or lifelong retention.
- From presence to neurodevelopmental harm, disease or a clinical recommendation.
The uncomfortable number in the methods
The paper reports overall cohorts of 18 control pups from 11 dams, 25 pups from 10 dams in the 50-nanometer group and 16 pups from seven dams in the 500-nanometer group. At 24 hours, recorded survival was 100 percent, 68 percent and 87 percent, respectively. Those figures demand attention. They do not support a clean claim that the smaller particles killed one-third of the newborn mice.
The authors explain why: outcomes included both acute death and pups lost through maternal cannibalism or infanticide, behavior they frequently observed. The study was not designed or powered to separate those causes or generate reliable lethality statistics. Litter and dam are also biologically meaningful units; pups from the same mother do not constitute fully independent replications.
The responsible response is neither to hide the numbers nor promote them as a toxicity result. They are a warning for the next experiment. A dedicated study would prespecify mortality and welfare endpoints, track each pup independently, account for litter, examine aspiration or gavage injury, use several doses, record maternal behavior and perform pathology. Until that work exists, the survival imbalance is unresolved—not proof and not nothing.
From visible pellets to invisible fragments
The scientific story began at a scale the eye could still grasp. In 1972, Edward Carpenter and K. L. Smith reported plastic particles across the western Sargasso Sea, averaging about 3,500 pieces and 290 grams per square kilometer. Many were brittle industrial pellets a few millimeters wide, already colonized by marine organisms.
In 2004, Richard Thompson and colleagues gave the field its durable question—“Lost at Sea: Where Is All the Plastic?”—and documented microscopic fragments and fibers in surface waters and sediments. “Microplastics” became the organizing term for pollution that fragmentation had made easy to overlook.
The next frontier was smaller than common infrared microscopes could routinely identify. Below a micrometer, particles become difficult to collect, count and chemically verify. Filters contaminate samples; airborne fibers fall into open vessels; digestion chemicals can alter polymers; fluorescent labels can detach; instruments may detect polymer mass without locating individual objects. The observer can become part of the contamination.
That measurement problem is why the Japanese paper matters beyond its single animal model. It combines spatial information with a spectral validation step and preserves whole-organ anatomy. It does not solve polymer quantification, but it helps connect the two worlds: analytical chemistry that asks “what and how much?” and imaging that asks “where?”
1972 — Carpenter and Smith report widespread plastic particles on the Sargasso Sea surface.
2004 — Thompson and colleagues document microscopic fragments and fibers; “microplastics” becomes the field’s defining term.
2013 — Japanese researchers introduce SeeDB, preserving fluorescent anatomy while clearing fixed brain tissue.
2016 — SeeDB2 improves refractive-index matching for high-resolution three-dimensional microscopy.
2025 — A major human autopsy study reports micro- and nanoplastics in brain tissue, followed by a methodological dispute over quantification and contamination controls.
2026 — The NIES–Osaka–Waseda team publishes a whole-brain light-sheet workflow for neonatal mouse biodistribution.
Human brain evidence: signal, controversy and no diagnosis
In 2025, a Nature Medicine study used pyrolysis gas chromatography–mass spectrometry, infrared spectroscopy and electron microscopy to report micro- and nanoplastics in human liver, kidney and brain samples collected at autopsy. The investigators found higher estimated concentrations in brain than liver or kidney, mostly polyethylene, and higher levels in 2024 samples than in 2016 samples.
The study attracted enormous attention—and a formal challenge. Other specialists argued that tissue digestion, biological lipids, contamination controls and validation steps could have inflated or confused the estimates. The original team defended its orthogonal methods while acknowledging uncertainty in even the best available nanoplastic detection. The exchange is science functioning in public: a consequential finding being stress-tested because the measurement is exceptionally difficult.
Neither the human autopsy report nor the Japanese mouse map shows that plastic caused dementia, developmental disease or any individual symptom. Postmortem association cannot establish cause, and a controlled mouse distribution experiment cannot supply human epidemiology. Together they justify better measurement and mechanistic work. They do not justify a medical test marketed to worried parents.
The World Health Organization’s 2022 review reached the same broad frontier: exposure through food, water and air is plausible, but major uncertainties remain in occurrence data, uptake, retention and health effects, especially for the smallest particles. In late 2025, the European Food Safety Authority began a new evidence review, with scientific advice expected by the end of 2027. The honest regulatory sentence remains longer than the viral headline.
What a perfect fluorescent bead leaves out
Model particles are useful because they hold variables still. Two clean sizes of one polymer allow investigators to isolate geometry better than a jar of environmental debris would. Fluorescent labeling makes a nearly invisible material visible. Standard spheres can be reproduced by another laboratory.
But the environment does not manufacture perfect controls. Sunlight oxidizes surfaces. Mechanical wear creates shards and fibers. Additives migrate. Metals and organic pollutants may adsorb. Proteins and lipids rapidly form coronas inside organisms. Particles clump, fragment again or become coated with microbes. Every change may alter transport and biological recognition.
Polystyrene is also only one member of the plastic economy. The 2025 human autopsy study reported polyethylene as dominant in its samples. Tire wear contains complex synthetic rubber and fillers; textiles shed fibers; paints release polymer-bound pigments. A workflow proven with bright polystyrene beads must be adapted to nonfluorescent, irregular particles whose polymer identity needs independent chemical confirmation.
The future experiment is therefore less photogenic and more realistic: mixtures collected from air, water or food; lower repeated doses; unlabeled particles; rigorous procedural blanks; stable-isotope or chemical tracing; several developmental stages; both sexes; multiple time points; and laboratories reproducing one another’s results.
Japan’s policy problem meets Japan’s imaging strength
Japan placed marine plastics on the international agenda at the 2019 G20 Osaka summit with the Osaka Blue Ocean Vision, which aims to reduce additional marine-plastic pollution to zero by 2050. The country has since promoted harmonized monitoring of floating microplastics and an Atlas of Ocean Microplastics.
Yet nets and common optical methods preferentially capture the larger end of the spectrum. Japan’s own policy documents acknowledge that methods and data for nanoscale particles remain underdeveloped. The farther research moves below a micrometer, the less a single tool can do everything: collection, polymer identification, mass measurement, counting and anatomical localization become separate problems.
The new study was supported by Japan’s Environment Research and Technology Development Fund and grants for developmental neurotoxicity and maternal-child health methods. That funding context explains the paper’s real destination. It is not a final risk verdict; it is infrastructure for experiments that regulators will eventually need—methods that can show where particles travel under increasingly realistic conditions.
Policy does not have to wait for a definitive brain-harm threshold to reduce needless plastic leakage. Better product design, capture of textile and tire emissions, pellet-loss prevention, waste management and reduced single-use material can have environmental benefits independent of uncertain neurological risk. But health claims should move at the speed of validated evidence, not at the speed of fear.
The next map must add time, chemistry and cells
The team’s method turns an intact brain into a coordinate system. The next step is to make it a movie in scientific time: minutes, hours, days and weeks after exposure. Does signal rise and then clear? Does it move from vasculature to ventricular interfaces or from CSF into tissue? Do 50-nanometer particles remain individual or aggregate?
Cell identity is the next layer. Co-labeling endothelial cells, pericytes, astrocytes, microglia, neurons, choroid plexus and ependymal cells could reveal which compartments hold signal. Electron microscopy or super-resolution imaging could test whether particles are intracellular. Polymer-specific mass spectrometry could anchor fluorescence to an absolute amount.
Dose design must separate mass, particle number and surface area. A range of lower repeated exposures can establish whether distribution is linear or whether biological barriers saturate. Naturally weathered particles and several polymers can reveal how much the clean polystyrene sphere predicts. Independent laboratories must repeat the workflow with blinded analysis and contamination controls.
Only after distribution is secure should the causal chain advance: inflammation, oxidative stress, synaptic development, behavior and long-term function. Even then, animal hazard data would need human exposure estimates and epidemiology. The destination is risk assessment; the current paper supplies a better compass.
- Which barrier and route carry the signal from gut to brain, and is it inside or outside blood vessels?
- How quickly are particles cleared, and do repeated low doses accumulate?
- Does the size pattern persist when doses are matched by particle count or total surface area?
- Which brain cells, if any, internalize the particles?
- Can unlabeled environmental particles be mapped and chemically confirmed in the same specimen?
- Do observed distributions produce reproducible molecular, structural or behavioral changes?
- How do developmental stage, sex, polymer, shape, charge, weathering and biological corona alter the map?
- What human exposure measurements are reliable enough to connect an animal dose to public health?
The value of a map that refuses to be a verdict
The most compelling scientific images often appear to settle an argument. Here are the particles. Here is the brain. Here is the glow. But an image can be both true and incomplete. This one records the fate of bright model spheres in a high-dose, 24-hour neonatal mouse experiment. It does not show ordinary life miniaturized.
Its importance lies in preserving the uncertainty spatially. The thalamus and brainstem are no longer vague entries in a list of dissected tissue; they are regions in an intact volume that future experiments can interrogate. The tenfold diameter difference becomes a whole-body contrast. A suspected route can now be tested against anatomy.
Fifty-four years after brittle pellets were counted on the Sargasso Sea, plastic science has moved from the ocean surface to a transparent newborn mouse brain. The object has become a thousand times smaller, then smaller again; the question has become correspondingly harder. We know that plastics fragment, that living organisms encounter them and that under controlled conditions nanoscale model particles can reach places larger particles scarcely illuminate.
What we do not yet know is the sentence the public most wants: what those encounters mean for a human life at an ordinary dose. The Japanese team has not supplied that verdict. It has done something science needs first. It has built a lantern, made an organ transparent and shown where to look next.
Reporting Notes and Sources
Scientific and policy information was checked through July 30, 2026, at 10:12 a.m. JST. The paper describes a high-dose proof-of-concept model and does not establish human exposure, neurotoxicity or clinical risk. The 375-microgram figure is the product of the reported 30-microliter administration volume and 12.5-milligram-per-milliliter concentration used for the principal size comparison. The geometric comparison assumes equal-density ideal spheres: a tenfold diameter difference corresponds to a thousandfold volume difference and, at equal mass, roughly a thousandfold particle-count difference and tenfold total-surface-area difference. Medical information is explanatory and not individual advice.
- National Institute for Environmental Studies: English research announcement and key findings
- National Institute for Environmental Studies: Japanese announcement, methods, figures, limitations and funding
- University of Osaka: research summary, authors and paper information
- Journal of Hazardous Materials Advances: “Whole-Tissue Distribution Analysis for Visualization of Nanoplastics in the Neonatal Mouse Brain”
- bioRxiv: preprint methods, doses, animal cohorts and survival caveat
- Cell Reports / PubMed: 2016 development of the SeeDB2 clearing agents
- Science: 2004 selective plane illumination microscopy paper
- Science: 1972 report of plastics on the Sargasso Sea surface
- Science: 2004 “Lost at Sea: Where Is All the Plastic?”
- Science: 2024 review of twenty years of microplastic-pollution research
- U.S. Environmental Protection Agency: size definitions and analytical-method challenges
- World Health Organization: 2022 review of dietary and inhalation exposure and human-health uncertainties
- European Food Safety Authority: new human-health evidence review due in 2027
- Frontiers in Pharmacology / NIH: barrier mechanisms in the developing brain
- Developmental Neurobiology / NIH: evidence against the myth of absent or simply “leaky” developing brain barriers
- Journal of Neuroscience: translating mouse and human brain-development time
- Nature Medicine: 2025 report of micro- and nanoplastics in human autopsy tissues
- Nature Medicine: methodological challenge to the human-brain measurements
- Nature Medicine: authors’ reply on detection uncertainty and quality control
- Japan Ministry of the Environment: Osaka Blue Ocean Vision and microplastic-reduction practices
- Japan Ministry of the Environment: harmonized monitoring and the Atlas of Ocean Microplastics