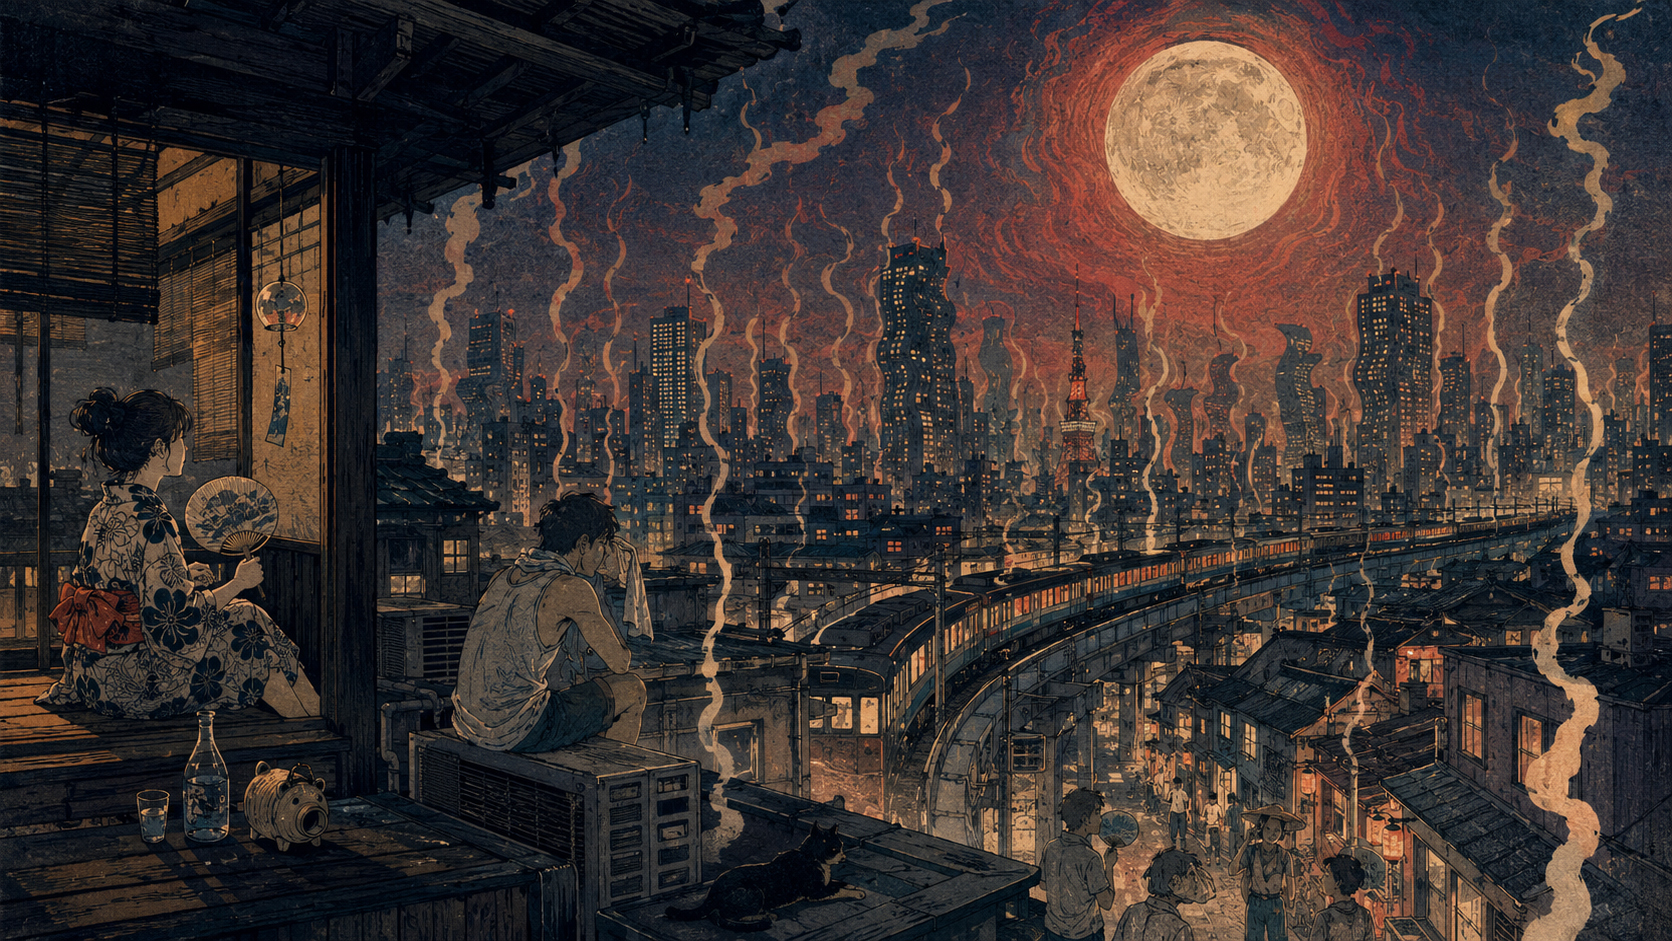
Have Japan’s four seasons disappeared? The familiar complaint that spring and autumn feel shorter is no longer merely impressionistic. A peer-reviewed study published in April found that the part of the year exceeding historically summer-like temperatures is expanding rapidly across midlatitude land, coasts and oceans. Japanese researchers have independently concluded that the country’s summer is advancing into spring and retreating later into autumn.
But “summer” does not mean the same thing in each analysis. Researchers draw a locally appropriate line through historical temperatures and count how long the annual curve remains above it. Change the baseline, threshold, geography or smoothing method and the number of added days changes. The direction of travel is consistent; the measurement is not singular.
Nor is 2026 a simple continuation of 2025. In June, only northern Japan was warmer than normal, while eastern and western Japan and Okinawa-Amami were near normal; rainfall was exceptionally high on many Pacific-facing areas. Yet after the rainy season, the Japan Meteorological Agency’s June 23 outlook placed the three-month temperature odds on the warm side, and the Japan Weather Association’s proprietary model projected six to ten location-days at or above 40°C nationwide. Long-term warming does not make every month uniformly hot. It raises the platform on which weather variability and pressure patterns operate.
How many days are in summer? Three valid answers
| Measure | Definition | What it reveals—and what it does not |
|---|---|---|
| JMA’s official season | Summer is June, July and August. Japan’s national seasonal statistics use this fixed window. | Excellent for year-to-year comparisons, but summer-like heat in May or September does not lengthen the season. |
| The 2026 UBC study | A fixed local threshold at the 75th percentile of 1961–1990 daily mean temperatures. Summer is the part of the smoothed annual cycle above it. | Allows a consistent comparison of global land, coasts and ocean. It is not astronomical summer or a count of heatwave days. |
| The Mie University Japan analysis | For each grid zone, the summer threshold sits one quarter of the way down from the annual temperature maximum toward the minimum. The first and last crossings define the season. | Reflects regional differences from Hokkaido through Kyushu and surrounding seas. Its numbers cannot be directly added to or averaged with the UBC result. |
Ted Scott, Rachel White and Simon Donner of the University of British Columbia used the European Centre’s ERA5 reanalysis and GHCN-Daily weather stations to study 1961–2023. They smoothed the jagged daily temperature series with Fourier regression. The day the curve crossed upward through the historical threshold marked summer’s onset; the downward crossing marked its withdrawal.
Across global midlatitudes, combining land and ocean, summer length increased by 4.8 days per decade over 1961–2023. Summer-like conditions in the mid-2020s therefore lasted roughly 30 days longer than in the 1960s. During the faster-warming 1990–2023 period, the increase was generally five to seven days per decade across inland, coastal and ocean surfaces. In the Northern Hemisphere, the corresponding trends were 5.1 days inland, 5.8 on coasts and 6.6 over the ocean.
Onset moved earlier and withdrawal later, but the study found another shift: the temperature transition into and out of summer is becoming sharper. As warming lifts the entire seasonal curve, its intersections with a fixed historical threshold move toward steeper parts of that curve. People, crops, power systems and schools may have less time to acclimatize and adjust.
Counting days is not enough: heat accumulates
One hundred days barely above a threshold are not equivalent to one hundred days far above it. The UBC team therefore calculated “accumulated heat,” combining duration with the number of degrees above the threshold. Over Northern Hemisphere land, the measure increased by 44°C-days per decade after 1990—more than triple the 14°C-days per decade recorded from 1961 to 1990.
That does not mean temperatures rose by 44°C. Forty-four days one degree above the benchmark would produce 44°C-days; so would 22 days two degrees above it. Because both duration and intensity are increasing, cumulative stress can grow nonlinearly even under a linear rise in mean temperature. That is closer to the burden felt by a body or a cooling system than a single daily maximum.
Tokyo: 2.1 days per decade, or 4.7?
Tokyo was one of ten cities examined in detail. Its historical threshold was a daily mean of 22.6°C. From 1990 to 2023, summer length increased by 2.1±1.4 days per decade in the station record and 4.7±1.2 days in the nearest ERA5 land grid cell. The errors are twice the standard error of each slope, approximating a 95 percent confidence interval.
It is important not to strip the 2.1 estimate of its uncertainty. The broad interval means the station trend is imprecise. ERA5’s roughly 25-kilometer grid may include Tokyo Bay, suburbs and land beyond the urban core. The station and the model-derived grid are not measuring exactly the same space. Their difference is a resolution warning, not evidence that one figure must be false.
Tokyo’s slower expansion than Sydney’s does not make the Japanese capital safe. Tokyo has a relatively broad annual temperature range of about 24°C, so an upward shift in the seasonal curve does not move the threshold crossings as dramatically. Yet temperatures within summer still rise, and urbanization strongly elevates nighttime minima. Summer’s length and its intensity must be read separately.
Japan’s own answer: 21.4 added days in 42 years
Mie University graduate student Mao Takikawa, Professor Yoshihiro Tachibana and colleagues divided the area from Hokkaido to Kyushu, including surrounding waters, into about 200 zones and analyzed JMA data from 1982 through 2023. Their nationwide mean summer onset moved 12.6 days earlier, while the ending moved 8.8 days later—a total expansion of 21.4 days.
Under their definition, summer lasted 92 days in 1982, from June 29 to September 28. In 2023 it lasted 121 days, from June 11 to October 9. Winter length changed little, meaning the added summer came largely at the expense of spring and autumn. An earlier phase of the work indicated that onset was advancing by roughly four to seven days per decade and withdrawal retreating by two to four.
The Japan-wide 21.4-day estimate, the global study’s roughly 30 days and Tokyo’s station and grid trends do not compete. They cover different periods and geographies and use different thresholds and processing. Their common signal is that temperatures associated with the historical summer now arrive earlier, depart later and carry more heat between those dates.
Why an island nation’s summer is expanding: the sea changes role
Japan’s seasons have long been delayed by water. The ocean warms and cools more slowly than land, making maritime summer later to start and later to end than continental summer. In spring, the sea cools warm air arriving from the Asian continent. In autumn, stored ocean heat slows the archipelago’s cooling. As the sea itself warms, spring’s cooling effect weakens and autumn’s heat reservoir persists.
JMA reports that the annual mean sea-surface temperature around Japan rose by 1.33°C per century from 1908 to 2024. The 2024 anomaly reached +1.44°C, the highest in that series. The Mie team identifies warming surrounding waters as a central mechanism stretching Japan’s summer at both ends.
The sea can also amplify an extreme season. In 2023, an extraordinary northward shift of the Kuroshio Extension replaced cool Oyashio water east of northern Japan with much warmer water. Research by JMA, the University of Tokyo, Hokkaido University and JAMSTEC found that the marine heatwave likely reduced low clouds, increased sunlight, transferred heat directly from ocean to air and strengthened water vapor’s greenhouse effect. Hot land and hot water are not separate stories.
Warming builds the platform; atmospheric circulation pulls the trigger
Each severe Japanese summer has its own mixture of the Pacific High, Tibetan High, jet-stream meanders, El Niño or La Niña, typhoons and foehn winds. In 2025, the westerlies shifted unusually far north and the Pacific High often covered the country, producing abundant sunshine. Those factors explain why a particular year becomes extreme.
Greenhouse gases raise the baseline on which those variations occur. JMA’s event-attribution analysis estimated that Japan’s record 2025 summer would have been virtually impossible without global warming. Even in the warmed climate of 2025, it remained approximately a one-in-60-year event. This is not a choice between natural variability and climate change; atmospheric and oceanic triggers acted on a warmer background.
Foehn winds intensify local disparities. Air descending after crossing mountains compresses, dries and heats, sometimes pushing inland Kanto, Tokai, Hokuriku and other leeward areas toward 40°C even when the national average is less dramatic. The same mean climate can produce sharply unequal danger depending on terrain and wind direction.
One hundred fifty years of observation: from an extreme day to an extreme season
Modern Japanese meteorology began in June 1875 at the Tokyo Meteorological Observatory in today’s Toranomon. The long national summer series reaches back to 1898 and is built from 15 geographically distributed stations with relatively stable records and limited urban influence. In that series, June–August mean temperature rose by 1.38°C per century through 2025.
| Year | A landmark in Japan’s heat history |
|---|---|
| 1933 | Yamagata reached 40.8°C on July 25. The national record stood for 74 years, showing how exceptional 40°C once was. |
| 1994 | Heat and drought beginning in spring brought water restrictions or outages to 40 prefectures. Agricultural losses reached ¥140.9 billion, linking heat to water, food and fire. |
| 2007 | Kumagaya and Tajimi reached 40.9°C, surpassing Yamagata. JMA also established “mōshobi,” or extremely hot day, for days reaching at least 35°C. |
| 2010 | The national summer anomaly reached +1.08°C, an extraordinary season at the time and still fourth highest through 2025. |
| 2013 | Ekawasaki in Kochi reached 41.0°C. The intervals between new 40°C-class records were shrinking. |
| 2018 | Kumagaya reached 41.1°C and eastern Japan recorded its hottest summer since the regional series began in 1946. Extreme heat followed catastrophic western Japan rainfall, revealing compound risk. |
| 2023–24 | Both summers posted a national anomaly of +1.76°C, then the record. Vital statistics counted 2,160 heat deaths in 2024, the highest total. |
| 2025 | The national anomaly reached +2.36°C. Summer mean records fell at 132 of 153 stations. Isesaki reached 41.8°C; 40°C-plus location-days totaled 30 and extremely hot location-days 9,385, all records. |
| 2026 | On April 17, JMA formally named a day at or above 40°C a “kokushobi”—an extreme heat day. A temperature once treated as exceptional now requires routine public-warning language. |
A single station’s maximum makes a vivid headline but cannot establish national climate change. Station moves, instruments, nearby construction and urbanization matter. JMA’s national series is designed to limit those influences. But when evaluating actual exposure in cities, urban heat cannot be dismissed as statistical noise. Climate warming and urbanization add together on the human body.
Tokyo does not cool at night
JMA’s 1929–2024 analysis finds that Tokyo’s annual mean temperature rose by 3.4°C per century, compared with 1.8°C across 15 less-urbanized stations. Tokyo’s summer mean rose 2.4°C per century, while its summer daily minimum rose 3.2°C. Urban effects appear most strongly in minimum temperatures—in other words, at night.
Concrete and asphalt store daytime energy; buildings alter wind; soil and vegetation disappear; air conditioners and vehicles release waste heat. The University of Tokyo’s Ocean Alliance notes that tropical nights were almost unknown in Meiji-era Tokyo, while 2023 recorded 57.
Nighttime heat attracts fewer records than the afternoon maximum, but it impairs sleep and recovery and compounds the strain of multiday heat. People unable or unwilling to use air conditioning, worried about electricity costs, living with broken equipment or less able to sense heat are especially vulnerable. Staying at home does not guarantee safety.
In 2025, heat sent 100,510 people to emergency care
Japan’s Fire and Disaster Management Agency recorded 100,510 heat-illness ambulance transports from May through September 2025, the highest total since nationwide tracking began in 2008. People aged 65 and older accounted for 57,433 cases, or 57.1 percent. Homes were the most common location, with 38,292 cases, 38.1 percent of the total. At initial examination, 36.4 percent required admission as moderate or severe cases, and 117 were pronounced dead.
Those statistics must not be mixed casually. “Dead at initial examination” in the ambulance dataset is not the same as all heat deaths counted later in national vital statistics, which include people who were not transported and deaths after arrival. The 2,160 confirmed deaths in 2024 and the 117 initial diagnoses in 2025 are different measures. Japan needs multiple indicators across exposure, transport, hospitalization and death precisely because no single series captures the whole burden.
Population aging turns climate into demographic risk. Reduced thirst and sweating, cardiovascular or kidney disease, medication, cognitive impairment, solitary living and poor housing can combine. National Institute for Environmental Studies research projects that heat mortality will rise toward midcentury as warming and extreme aging interact, even when long-term acclimatization is included. Adaptation must be designed around the least protected home and the most isolated resident, not a healthy average adult.
WBGT is closer to the body than air temperature
Air temperature alone does not measure danger. Wet-bulb globe temperature, or WBGT, incorporates humidity and radiant heat as well as temperature. High humidity limits sweat evaporation; direct sun, hot ground and nearby machinery add radiant load. The same thermometer reading can therefore produce very different physiological stress.
Japan’s Heatstroke Alert is issued for a forecast area when at least one monitoring site is expected to reach a daily maximum WBGT of 33 or above. The Special Heatstroke Alert, introduced in 2024, generally covers the far more severe case in which every monitoring site in a prefecture is forecast to reach 35 or above. Municipal cooling shelters are opened under the special alert system.
An alert does not remove heat. It works only if someone has already decided who contacts a night worker, a student, a caregiver or an older person without cooling—and what action follows. Success should be judged not by notifications sent but by indoor temperatures, canceled exposure, hospital demand and whether the most vulnerable were reached.
Work: beyond “drink more water”
In 2025, workplace heat illness caused death or at least four days away from work in 1,803 cases, including 19 deaths. That was a sharp increase from 1,257 cases in 2024. Construction, manufacturing, security, delivery and agriculture are among the sectors where workers face heat, protective equipment, fixed schedules or little authority to stop.
Revised occupational-safety regulations took effect in June 2025. For work expected to last more than one continuous hour or more than four hours in a day at WBGT 28 or air temperature 31°C, employers must establish a reporting system, response procedures and worker communication. The rules target the common pathway from ignored early symptoms and delayed discovery to a fatal outcome.
A longer summer turns temporary emergency measures into months of operating practice. Starting earlier does not solve a hot dawn or sleep deprivation. Contracts and schedules must include breaks, shaded and cooled recovery rooms, limits on continuous work, staffing, multilingual training, cooling equipment and acclimatization. Most important, the worker with the least bargaining power must have a real right to stop without losing pay or employment.
Schools and sport: summer vacation is no longer a safety boundary
NIES and Waseda University modeled hourly WBGT across 842 Japanese cities using machine learning. Their sports thresholds were WBGT 28 for stopping intense exercise and 31 for stopping all exercise. Under a high-emissions scenario in the 2060s–2080s, six of eight climate regions reached the first restriction and four reached the second. The total restricted period reached 19 region-months per year, with the longest-affected region limited for six months.
Even under deep emissions cuts, five regions reached the intense-exercise threshold and one the all-exercise threshold, but the overall burden was substantially lower. Moving practice to early morning or replacing two hot outdoor days per week with air-conditioned indoor activity helped, yet it did not preserve business as usual. Tournament calendars, class times, summer holidays, gymnasium cooling, indoor facilities and relocation to cooler areas require structural change.
A culture of endurance becomes abandonment of safety when the climate premise changes. Children cannot cancel their own tournament. The duty to stop belongs to coaches, schools, governing bodies and local governments.
The dinner table: cloudy rice grains are temperature records
Excess heat during rice ripening disrupts starch formation and produces chalky, immature grains. The agriculture ministry’s preliminary 2025 survey found reported effects across 30–40 percent of planted area nationally and 50–60 percent in western Japan. Heat-tolerant varieties expanded to 248,000 hectares, 18.2 percent of table-rice planting, but remain a minority.
Longer heat also overlaps with poor fruit coloring and sunburn, tomato fruit-set failure, delayed strawberry flower-bud development, lower dairy-cow output, pest pressure and water shortages. Changing planting and harvest dates, irrigation, shade, ventilation and varieties can help, but each requires capital, seed supply, marketing and often new brand standards. Telling individual farmers to adapt is not a food-security strategy.
Heat alters quality grades and farm income as well as yield. Japan must track heat-tolerant acreage, irrigation capacity, worker illness, agricultural insurance and research investment together.
The history of adaptation: from warnings to law
| Period | Institutional change | What remains unresolved |
|---|---|---|
| 2007 | JMA standardized “mōshobi” for a day at or above 35°C. | Temperature alone does not express humidity, radiation or nighttime danger. |
| 2008 | FDMA began nationwide tracking of heat-illness ambulance transports. | Non-transported illness, deaths and long-term effects require linked statistics. |
| 2021 | The environment ministry and JMA launched the national Heatstroke Alert. | Local translation from warning to cancellation and assistance remains uneven. |
| 2023–24 | Japan revised the Climate Change Adaptation Act, adopted a Heatstroke Countermeasures Action Plan and created the special alert and cooling-shelter system. The 2030 goal is to halve heat deaths from the current baseline. | Permanent investment is needed in housing, energy poverty, outreach staff and nighttime access, not only emergency-day alerts. |
| 2025 | Employers became responsible for reporting systems, response procedures and communication in qualifying hot work. | Enforcement, subcontractors, self-employed workers, night shifts, stop-work authority and compensation remain tests. |
| 2026 | JMA formally adopted “kokushobi” for a 40°C day. | The new language must trigger predetermined transport, school, event and labor rules. |
The national goal to halve deaths by 2030 is ambitious, but its “current” baseline is moving as the climate warms. Repeating the same intervention can reduce individual risk while total harm still rises. Japan needs adaptive policy that reviews deaths, transports, indoor temperatures, cooling access and compliance every year, then strengthens measures accordingly.
End of the century: two very different Japans
JMA and the education ministry’s “Climate Change in Japan 2025” compares the late 20th century, 1980–1999, with 2076–2095. In a scenario associated with a 2°C warmer world, Japan’s annual mean rises by about 1.4±0.4°C. Days at or above 35°C increase by 2.9±1.7 per year and tropical-night-type days by 8.2±3.2.
In the 4°C scenario, Japan’s annual mean rises by 4.5±0.6°C. Extremely hot days increase by 17.5±5.0 per year and tropical nights by 38.0±6.6. These are national means. Already-hot cities and basins can fare worse, while places such as Hokkaido, where building design and air-conditioning prevalence differ, face rapid adjustment to unfamiliar heat.
| National mean change by late century | 2°C warming scenario | 4°C warming scenario |
|---|---|---|
| Annual mean temperature | +1.4 ± 0.4°C | +4.5 ± 0.6°C |
| Days at or above 35°C | +2.9 ± 1.7 days/year | +17.5 ± 5.0 days/year |
| Tropical-night-type days | +8.2 ± 3.2 days/year | +38.0 ± 6.6 days/year |
| Frost days | −16.6 ± 6.5 days/year | −46.2 ± 6.5 days/year |
Adaptation is necessary in both futures, but adaptation alone cannot erase the difference between them. Trees, insulation, shade, cooling and shelters save lives. Emissions cuts reduce the amount of heat against which every future protection must work. Mitigation and adaptation are complements, not alternatives.
Rebuilding Japan around the long summer
First comes housing. Cooling should be treated as life-support infrastructure, paired with insulation, exterior shading, ventilation, reflective roofs and efficient equipment. Public support must reach rental properties and low-income households, and include electricity assistance, maintenance and a safe destination during outages. Air conditioning alone can add waste heat, peak demand and blackout risk.
Second comes the city. Tree canopy, continuous shade, water-retaining pavement, cool roofs, waterways and ventilation corridors should be placed along routes people actually use. Performance should be measured at bus stops, school routes, construction sites and top-floor apartments—not only as an average surface-temperature improvement.
Third comes time. Schools, sports, construction, delivery, tourism and festivals must abandon the assumption that only June through August is summer. Acclimatization, suspension and indoor-work rules should cover abrupt heat in May and persistent heat in September and October. Sharper seasonal transitions make early warning more important.
Fourth comes social infrastructure. Home visits to isolated older residents, indoor-temperature checks by care services, multilingual information, support for unhoused people, cooling shelters open at useful hours, surge staffing for ambulances and hospitals, and air-conditioned school gyms must be funded before a heat emergency. Heat is meteorological; who dies is shaped by income, age, housing and working conditions.
What to watch in the summer of 2026
| Indicator | How to read it |
|---|---|
| JMA one- and three-month outlooks | They are probability forecasts, not certainties. Separate region and month and use the latest update. |
| WBGT and heat alerts | Use humidity, radiation, nighttime values and measurements at the activity site—not only maximum air temperature. |
| 40°C location-days | JWA’s six-to-ten forecast is from a proprietary model, separate from JMA’s official seasonal outlook. It counts location-days, not necessarily unique locations. |
| Ambulance transports | Track age, place and severity. Do not equate deaths at initial examination with national vital-statistics deaths. |
| Nighttime minimums | A city can avoid an afternoon record while repeated tropical nights prevent recovery. |
| School and work suspensions | Measure reduced hours, indoor transfer, cancellations and compensation—not merely whether warnings were issued. |
| Agriculture | Track quality grades, pests, water, worker health and heat-tolerant varieties in addition to yield. |
| Sea-surface temperature | Stored heat around Japan can sustain humidity and autumn warmth and can amplify extremes in northern Japan. |
The fact that June 2026 was not a nationwide heat record does not disprove warming. Likewise, a warm July–September outlook does not mean every place will break records every day. Weather describes conditions across days to seasons; climate describes the shifting probability distribution over decades. Policy must react to tomorrow’s forecast while rebuilding for the multidecade rise.
Conclusion: mourning the four seasons is not enough
The case for a longer Japanese summer is strong not because of one dramatic simulation but because different methods point in the same direction. Global observations and reanalysis find about an extra month of midlatitude summer-like conditions. Japan’s regional analysis finds 21.4 added days over 42 years. Tokyo’s station and grid estimates differ, but both lean longer. JMA’s national record shows that summer itself warmed by 1.38°C per century.
Uncertainty is not a reason for paralysis. Tokyo’s confidence interval, competing definitions of summer and the probabilistic 2026 outlook help refine where and when to intervene. They do not erase the need. The 100,510 transports in 2025, 2,160 confirmed deaths in 2024, damaged rice and future restrictions on school sport show that seasonal change is already a design condition for Japanese society.
What is being lost is not only the beauty of a comfortable spring or autumn. Japan is losing nighttime recovery, safe outdoor working hours, children’s exercise time, the temperature window in which crops ripen, and spare capacity in the power and medical systems. The country must move beyond advising people to “take care” and become a place where stopping in dangerous heat does not cost a person income, education or dignity. The long summer is not next year’s anomaly. It is this century’s infrastructure.
Sources and further reading
- Scott, White & Donner, Environmental Research Letters (2026) — Methods and findings for midlatitude summer length, transition speed, accumulated heat and ten cities including Tokyo.
- University of Tokyo Ocean Alliance: Japan’s summer is lengthening at both ends — The Mie University method, regional results, maritime mechanism and Tokyo tropical nights.
- Mie University: Japan’s summer lengthened by three weeks in 42 years — University record of the Takikawa–Tachibana group’s findings.
- Japan Meteorological Agency: Japan summer temperature anomaly — The 1898–2025 trend and ranking of the hottest summers.
- JMA: Weather of summer 2025 — The +2.36°C anomaly, 132 station records, 9,385 extremely hot location-days and circulation pattern.
- JMA Climate Change Monitoring Report — The 41.8°C record, 30 days at 40°C or above and event attribution.
- JMA and MEXT: Climate Change in Japan 2025, Chapter 4 — Observations, urbanization and late-century projections under 2°C and 4°C scenarios.
- JMA: Urban heat-island trends — Mean, maximum and minimum temperature trends in Tokyo and other cities, 1929–2024.
- JMA, University of Tokyo and partners: the 2023 northern Japan marine heatwave — Kuroshio Extension, cloud, sunlight, ocean heating and water-vapor mechanisms.
- JMA: 150 years of meteorological services — The 1875 Tokyo observatory and Japan’s modern observation history.
- JMA: Heat and drought of 1994 — Water restrictions, outages, agricultural damage and fires.
- JMA: All-time national temperature rankings — Yamagata 40.8°C and subsequent record locations.
- JMA: naming 40°C-plus days “kokushobi” — The April 17, 2026 official designation.
- JMA: Weather of June 2026 — Northern heat, Pacific-side rainfall and regional observations.
- JMA: Three-month outlook issued June 23, 2026 — Regional July–September temperature and precipitation probabilities.
- Japan Weather Association: midsummer 2026 outlook, July 10 — Proprietary forecast of six to ten 40°C location-days plus rainfall and typhoon risks.
- Fire and Disaster Management Agency: 2025 heat-illness transports — 100,510 cases by age, place and initial severity.
- National Institute for Environmental Studies: warming, aging and heat mortality — The confirmed 2,160 deaths in 2024 and future projections.
- Ministry of Health, Labour and Welfare: workplace heat illness — Injury and death totals from 2016–2025, including 1,803 cases and 19 deaths in 2025.
- MHLW Kumamoto Labour Bureau: mandatory workplace heat measures — WBGT, temperature and duration thresholds and employer duties.
- NIES and Waseda University: future heat and school sports — Hourly WBGT for 842 cities, emissions scenarios and adaptation tests.
- Ministry of Agriculture: preliminary 2025 global-warming impact survey — Chalky rice, heat-tolerant varieties and crop impacts.
- Ministry of the Environment: Heatstroke Countermeasures Action Plan — The 2030 mortality-reduction target and revised adaptation law.
- Ministry of the Environment: Special Heatstroke Alert — WBGT 33 and 35, cooling shelters and recommended action.
Editor’s note: This article is based on peer-reviewed research and materials from JMA, the environment, fire, health and agriculture ministries, NIES and universities available by 10:37 a.m. JST on July 17, 2026. The 2026 summer is still in progress; this is not a final annual or seasonal assessment. The UBC study, Mie analysis and JMA’s fixed season use different definitions, so their day counts should not be combined directly. Tokyo’s station trend carries an uncertainty interval approximating 95 percent confidence. JWA’s 40°C estimate is a proprietary location-day forecast, separate from JMA’s official seasonal outlook. Deaths at initial medical examination and deaths in national vital statistics are treated as different indicators.