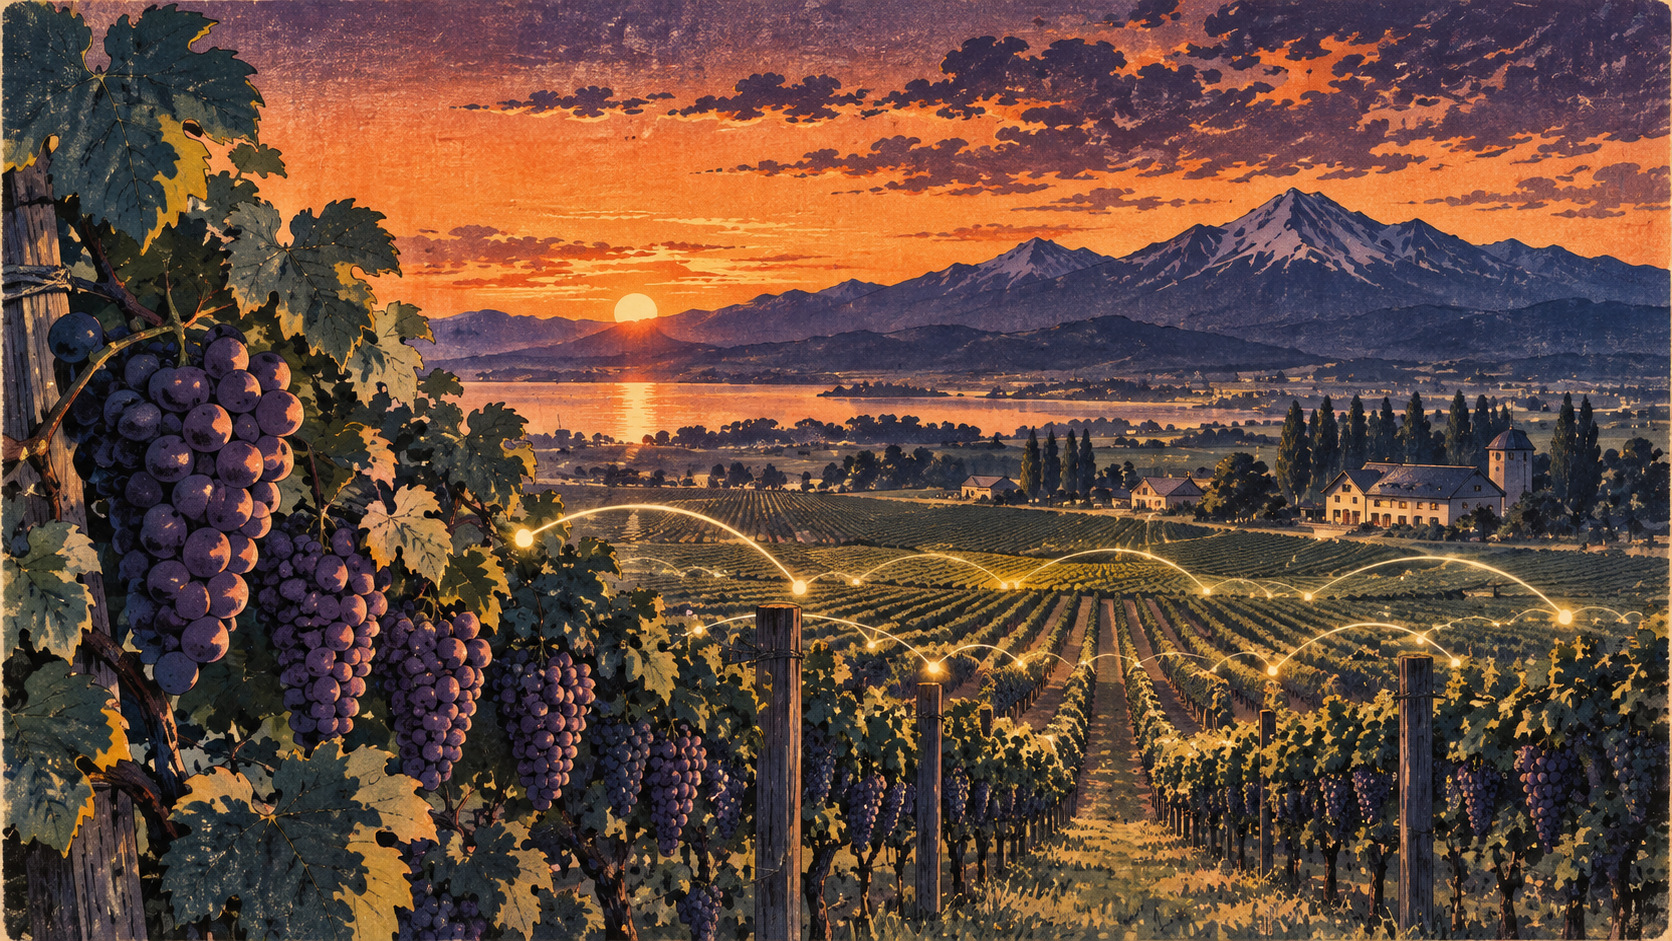
When AI enters the vineyard
In Yoichi, one of Japan’s most closely watched wine regions, grape clusters are becoming data as well as fruit. Hokkaido University announced on October 8 that researchers had developed a model for predicting grape-berry growth through image analysis, combining artificial intelligence with plant biology. The aim is not flashy automation for its own sake. It is to give growers and researchers a non-destructive way to monitor development more frequently, helping them think more carefully about harvest timing, sampling schedules and vineyard management.
Why berry growth is hard to measure in the field
Wine grapes ripen in open conditions that are visually messy. Lighting changes. Berries overlap. Leaves hide parts of the cluster. Wind alters angle and apparent size. Traditional manual measurements with calipers can be accurate, but they are laborious and can require sampling that disturbs the fruit. The Hokkaido team approached the problem by focusing not on perfectly recovering every millimeter in every image, but on tracking relative growth trends robustly under field conditions. For growers, the practical value lies in understanding developmental timing—where a cluster sits on its growth curve—rather than extracting an abstract number with no agronomic context.
A Hokkaido wine story, not just an AI story
The field work centered on the Yoichi Orchard of Hokkaido University’s Experiment Farm and used two wine-grape cultivars, Kerner and Zweigelt. That location matters. Yoichi Town was designated the “Special District for Wine, Northern Fruit Kingdom” in 2011, the first such wine special zone in Hokkaido. Since then, the area around Yoichi and neighboring Niki has emerged as one of Japan’s most dynamic wine regions, supported by a growing winery base and a climate often described as favorable for high-quality wine grapes. The research therefore sits at the intersection of academic agriculture and regional industrial development.
How the system works
The published paper describes a pipeline built around YOLOv8s, a modern object-detection model. Images of grape clusters were captured in the field, with a 1-centimeter scale marker included so pixel measurements could be converted into physical size estimates. But the research did not simply run object detection and declare victory. Field images can produce spurious shrinkage when berries overlap, fall off, or are viewed at awkward angles. To address that, the team added a biology-informed, monotonicity-constrained smoothing step—called “F-smoothed”—based on the assumption that berries do not shrink during early growth. That adjustment transformed noisy observations into curves that make agronomic sense.
What the metrics actually show
According to the Horticulture Journal paper, the hold-out validation of the YOLOv8s detector produced mAP50 of 0.931, mAP50–95 of 0.704, precision of 0.906 and recall of 0.875. In a separate laboratory validation using detached berries from the 2025 season photographed against a white background, image-derived diameters matched manual caliper measurements closely across a range of roughly 0.3 to 2.3 centimeters. The mean absolute error was 0.08 centimeters, the root mean square error was 0.09 centimeters, and R² reached 0.97. Those are strong results. They indicate that, under the study’s conditions, the imaging approach tracked berry size credibly. They do not mean the system is already guaranteed to perform identically in every vineyard and every season.
Two bursts of growth, not one smooth line
One of the most interesting findings is biological rather than computational. After applying the F-smoothed algorithm, both Kerner and Zweigelt displayed the classic double-sigmoid growth pattern known in grape physiology, with two distinct rapid growth phases, mainly in July and August. That matters because it shows the system is not merely producing smooth curves; it is recovering interpretable developmental structure. In crop science, a model becomes more useful when it can reflect the biology growers and researchers already understand, rather than generating outputs that are numerically impressive but agronomically opaque.
The history behind the urgency
Japanese wine has a long history, but the current moment is defined by the rise of regional identity and smaller-scale production. Yoichi and Niki have become emblematic of that shift. Official local materials trace Yoichi’s wine story through the opening of Domaine Takahiko in 2010, the 2011 special-zone designation, and the subsequent expansion of local wineries. Better vineyard observation, in that context, is not a niche technical improvement. It belongs to a broader effort to make Japanese wine more consistent, more expressive and more competitive. Great wine is decided not only in the cellar, but in the field—through choices about observation, sampling and harvest.
Smart agriculture needs domain knowledge
The study also offers a useful correction to simplistic narratives about AI replacing farm experience. In this case, the machine-learning component alone was not enough. The initial growth curves could still be distorted by occlusion and apparent size loss. The model became agronomically meaningful only after the researchers imposed biological knowledge through the smoothing step and fitted double-sigmoid growth curves. This is an important lesson for agricultural AI more broadly. Success often depends less on generic intelligence than on how well a system absorbs the logic of a specific crop, environment and management question.
What the study does not yet prove
Several limitations matter. The field case study covered ten clusters in the 2024 season and focused on only two cultivars in one research orchard in Yoichi. Conditions in commercial vineyards may differ in canopy structure, training systems, weather, lighting, disease pressure and camera setup. Moreover, berry growth is only one part of ripening. Actual harvest decisions also depend on sugar, acidity, phenolic maturity, disease status, weather forecasts and stylistic goals for the wine. Hokkaido University described the work as a foundational technology for smarter cultivation and harvest timing—not as a finished autonomous harvest-decision system.
A model for where agricultural research is heading
Even with those caveats, the work is a persuasive example of where Japanese agricultural research is heading: toward systems that are data-rich without becoming biologically naive. The author list—Jixiao Li, Teruo Sone, Xiangji Meng, Kentaro Hirayama, Minoru Ikuta, Yoshihisa Inose and Yoichiro Hoshino—reflects that blend of field science and technical modeling. The significance of the paper lies not just in a new set of metrics, but in its method: high-frequency, non-destructive observation tied to the realities of a specific crop and a specific place. The next question is how broadly that method can travel—from a research orchard in Yoichi to the working vineyards that now define one of Japan’s most ambitious wine regions.
Sources and supporting documents
- 北海道大学「AI画像解析でブドウ果実の成長を予測するモデルを開発」2026年10月8日
- 北海道大学北方生物圏フィールド科学センター 研究発表
- The Horticulture Journal: Monitoring Relative Grape Berry Growth in the Field with YOLOv8 and Biology-informed Smoothing
- J-STAGE article page (The Horticulture Journal, Vol.95 No.3, pp.378–388)
- 余市町公式「ワイン特区について」
- 余市町ワインツーリズムプロジェクト「ワインの歴史」
- 余市・仁木ワインツーリズムプロジェクト(英語)