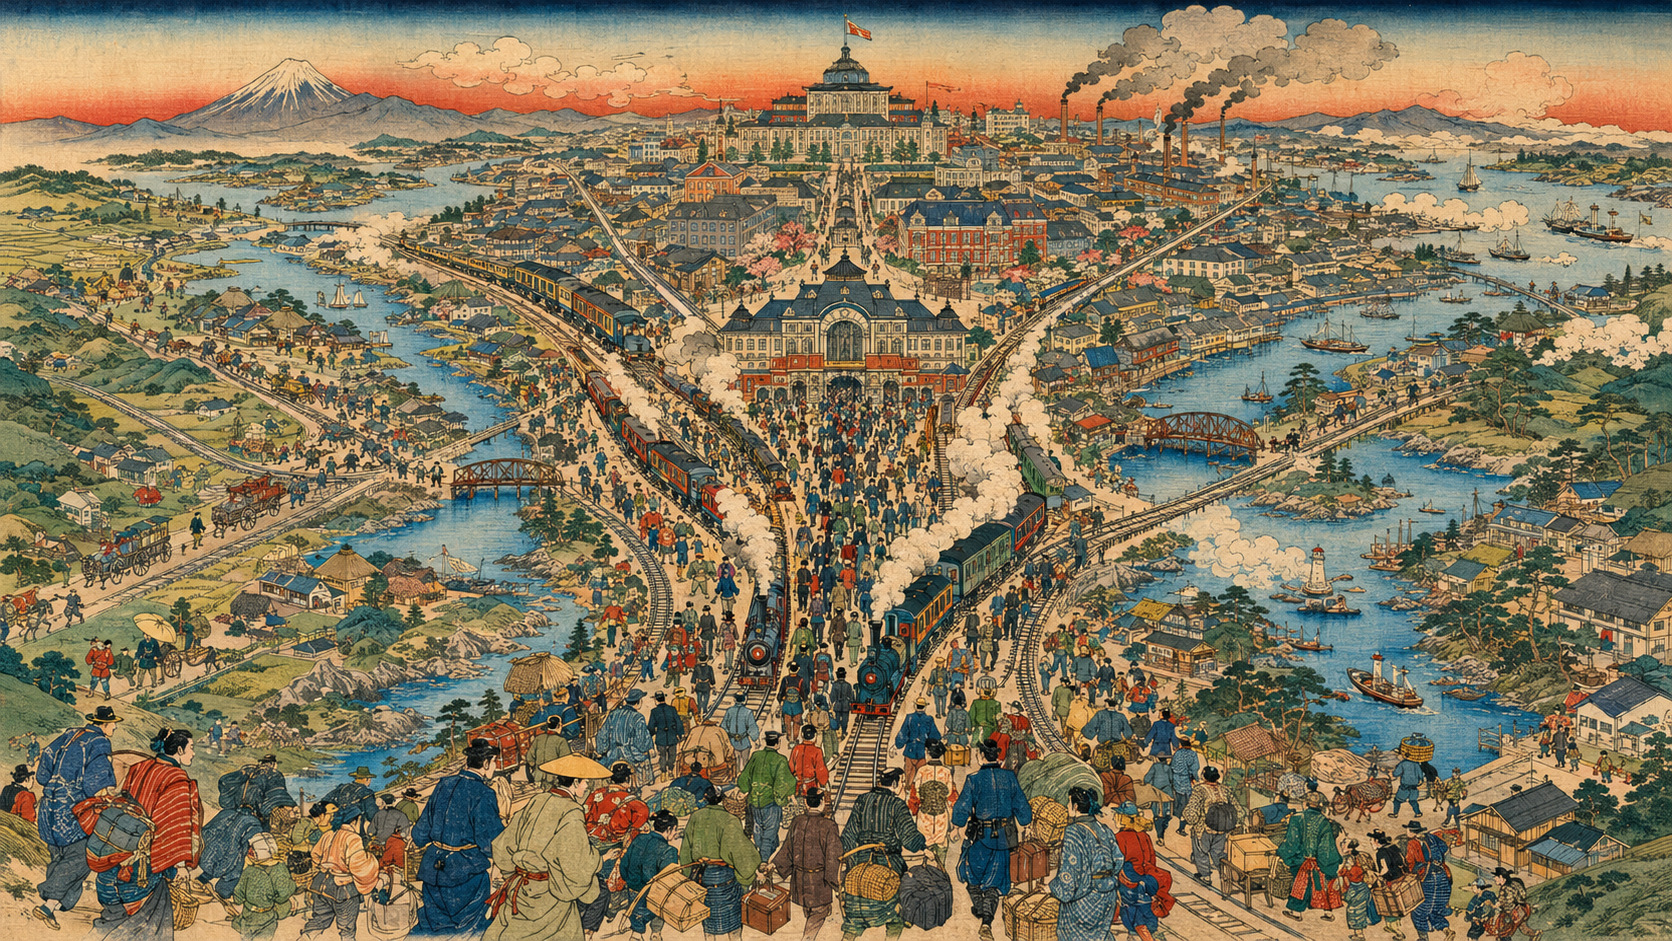
Every March, Tokyo's gravity becomes visible. University acceptance letters, first company badges, moving trucks and commuter trains extending into the suburbs are individual choices. Added together, they change the shape of a country. In 2025, 123,534 more people moved into the four-prefecture Tokyo Area from elsewhere in Japan than moved out. That was 12,309 fewer than a year earlier. It was still the third consecutive year above 100,000, and among Japanese movers alone it marked a 30th consecutive annual surplus.
The 2026 Capital Region White Paper, approved by the Cabinet on July 10, places that present-day flow before a much longer mirror. Its special feature, “Showa 100,” looks back a full century from the start of the Showa era in 1926. The eight-prefecture Capital Region held 11.71 million people in 1920, or 20.9% of Japan. By 2024 it held 44.36 million, or 35.8%. Japan's total population peaked in 2008, but the Capital Region continued to expand until 2020 and has since remained nearly flat. As the country contracts, the capital's relative weight rises.
Yet “Tokyo overconcentration” is larger than a headcount. Of Japan's ordinary and consolidated corporations capitalized at ¥100 million or more, 61.7% are based in the Capital Region and 50.5% in Tokyo itself. The Capital Region hosts 88.9% of foreign-affiliated companies covered by the report; Tokyo alone hosts 75.8%. The region produces 40.1% of nominal prefectural GDP, more than its share of population. Jobs, capital, universities, ministries, culture and transport interchanges attract one another, allowing urban gravity to reproduce itself.
“Tokyo concentration” is bigger than Tokyo's population
Unpacking the boundaries reveals several demographic clocks ticking inside the same megaregion. Tokyo Metropolis had about 14.18 million people in 2024. The three neighboring prefectures—Saitama, Chiba and Kanagawa—had about 22.81 million, while Ibaraki, Tochigi, Gunma and Yamanashi had about 7.37 million. Tokyo was still growing. The three neighbors had declined from a 2020 peak; the outer four had been declining since their 2001 peak. The giant region is not growing as a single organism.
Natural decrease has spread through every part of it. Deaths exceed births, while domestic and international inflows fill some of the gap in Tokyo and other places. The Capital Region's Japanese population peaked in 2019; rising foreign-resident numbers now make an important contribution to its total. The industrial town of Oizumi in Gunma, central Shinjuku, the resort town of Hakone and agricultural Yachiyo in Ibaraki attract different nationalities for different reasons. Internationalization is not simply a downtown phenomenon.
That is why the familiar picture of Tokyo sucking population from the rest of Japan can mislead. Someone who moves from a Tokyo ward to Saitama and continues to work in the city produces an outflow from Tokyo Metropolis while reinforcing concentration in the Tokyo Area. A factory can move to northern Kanto while its headquarters, finance, research, advertising and final decisions remain downtown. Residential dispersal and command-function concentration can occur at the same time.
1923: Destruction opened the plans for a modern capital
The white paper's century begins shortly before Showa. Industry and population crowded into Tokyo during and after the First World War, but a street pattern inherited from Edo could not keep pace with modern transport, sanitation and commerce. Shinpei Goto, who had helped shape the 1919 City Planning Act, became mayor in 1920. His sweeping plan for municipal renewal addressed roads, the port, parks, water and sewerage, waste, housing, education and social services.
On September 1, 1923, the magnitude 7.9 Great Kanto Earthquake destroyed the capital. Back in national office as home minister, Goto became the central figure in the Imperial Capital Reconstruction Agency. Reconstruction through 1930 combined land readjustment, arterial roads, bridges, parks and river work. Budgets and politics reduced Goto's grander ambitions, but Showa-dori, Yasukuni-dori, the reconstructed bridges across the Sumida and a network of small parks gave post-disaster Tokyo a new frame.
Two logics of concentration were already intertwined. A dense population makes large investments in railways, roads, water and disaster protection efficient. As those investments make the city safer and more useful, more people arrive. But one earthquake or fire can also interrupt the political, financial and commercial center of the country at once. The productivity of concentration and the vulnerability of concentration were twins born from the same infrastructure.
1945: Tokyo fell below 3.5 million—and immediately began to return
In 1945, bombing reduced Tokyo to ruins barely two decades after the earthquake. The Capital Region held roughly 15 million people, but Tokyo's population had fallen from 7.36 million in 1940 to 3.49 million. The government drafted a war-damage reconstruction plan, then sharply cut it in 1950 under the fiscal austerity of the Dodge Line. Meanwhile demobilization, repatriation, births and the search for work were bringing people back. Tokyo reached about 6.28 million in 1950 and 8.04 million in 1955.
Manufacturing fueled by Korean War procurement acted as a magnet. Population growth from 1950 to 1955 was especially large in Ota, Setagaya, Shinjuku and Koto wards and in Yokohama and Kawasaki. Housing shortages, packed trains, factory pollution, land prices and uncontrolled development were no longer problems that Tokyo could solve inside its own border. The question became how to plan the capital and its surrounding territory as one region.
1956: Japan wrote a law to contain the capital
The Capital Region Development Act was enacted in 1956. The first Capital Region Development Plan followed in 1958 and covered a 100-kilometer radius around central Tokyo. Its concept was crisp. A greenbelt roughly ten kilometers wide would encircle the already urbanized districts of Tokyo, Yokohama and Kawasaki, restraining continuous expansion. New industrial cities beyond it would absorb additional factories and people. The approach drew from London's ring of protected green land.
People outran the plan. Tokyo's population had already reached roughly 9.7 million by the 1960 census. Housing and urban development spread into land intended for the belt; property rights and local governments' appetite for development made a continuous designation impossible. This was more than a planning failure. As long as jobs stayed concentrated in the center, opening suburban land and connecting it by rail was the fastest answer to a severe housing shortage.
The 1965 amendment and the second development plan in 1968 accepted that reality while attempting to guide it. The statutory Capital Region expanded to the full territory of Tokyo and seven prefectures. The greenbelt proposal gave way to a Suburban Development and Redevelopment Zone, where planned growth would be balanced with controls on disorderly urbanization and protection of important green areas. Farther out, Urban Development Areas could foster research, education, distribution and housing as well as industry. A ring intended to contain Tokyo became a set of layers supporting it.
- Built-up area: The 23 wards, Yokohama, Kawasaki and other developed districts. Policy would preserve urban functions while preventing excessive concentration.
- Suburban zone: A greenbelt about ten kilometers wide intended to prevent continuous outward expansion. It was never fully designated and was abolished in the 1965 revision.
- Outer area: New industrial cities would absorb people and factories. The idea evolved into Urban Development Areas, northern Kanto industrial centers and Tsukuba Science City.
1964: A national celebration wired Japan into Tokyo
Rapid-growth Tokyo used the 1964 Olympics as an urban deadline. The Tokaido Shinkansen, the Metropolitan Expressway and the Tokyo Monorail opened; roads, hotels and sewers were built. These projects processed Tokyo's congestion, but they also shortened the distance from the rest of Japan to the capital. Infrastructure intended to make the center function better enlarged its field of attraction.
Private railways combined transport and land development, tying central employment to suburban housing. Tama, Chiba and Kohoku new towns, public apartment estates and private subdivisions absorbed the nuclear family's aspiration for a home. Tokyo's population stabilized around 1975, but Saitama, Chiba and Kanagawa surged. Their combined population rose from approximately 10.15 million in 1965 to 17.08 million in 1980.
On a map, that looked like decentralization. Every morning, the trains pointed inward. Separating homes outside from jobs inside made long commutes and crush-loaded cars part of normal life. Suburban municipalities raced to build schools, roads, sewers and parks. Families paid for the regional imbalance in hours. Part of the cost of Tokyo concentration had been allocated beyond Tokyo's administrative boundary.
Tsukuba and northern Kanto: Successful dispersal had jobs
The white paper's most important lesson from postwar spatial policy is that housing alone does not make a city. Industrial areas such as Ota-Tatebayashi, Sano-Ashikaga, Oyama and Kashima attracted residents because factories created work. Tsukuba Science City was built to establish a high-level research and education center while relieving excessive population and institutional concentration in central Tokyo.
The 1970 Tsukuba Science City Construction Act, Expo 1985 and eventually the Tsukuba Express layered national institutes, a university, companies, housing and transport. Tsukuba became an independent center because it developed a specialist labor market and knowledge network rather than moving a single function. Northern Kanto industrial cities likewise gained demographic weight where machinery and automobile-related manufacturing generated durable employment.
By contrast, a bedroom community without its own employment base can age as the founding generation grows old and its children leave. If daytime work is scarce and retail and transport depend on a shrinking population, service loss compounds decline. Dispersal is not the movement of residential addresses. It is the movement of jobs, education, medicine, culture, transport and decision-making as a bundle.
The 1980s: Land prices hollowed out the center
After the 1985 Plaza Accord, a stronger yen and abundant finance helped push land prices sharply upward. Offices and speculation displaced housing in the center. Tokyo lost residents even as its daytime population grew. The 1987 Fourth Comprehensive National Development Plan adopted a “multipolar, dispersed national land” as its goal. A 1988 law promoted relocation of national agencies and the development of business core cities.
Fourteen business-core areas—including Yokohama, Kawasaki, Chiba, Saitama and Hachioji-Tachikawa-Tama—were meant to replace the Tokyo wards' single-pole structure with multiple centers. Some national agencies moved to places including Saitama New Urban Center. Yet the combination of corporate headquarters, financial markets, national media and central government remained in Tokyo. Branches and back offices could disperse while final decisions kept the most important face-to-face networks in the capital.
Restrictions on real-estate lending beginning in 1990 and the collapse of the bubble sent land prices down. After years of decline, prices found a floor in the 2000s. That made a different kind of reconcentration possible. Central housing became relatively more attainable; high-rise condominiums and redevelopment brought households back. The model began to shift, at least for some residents, from “home in the suburb, job in the center” to “home and job in the center.”
2002: Urban regeneration sharpened Tokyo's pull
The national government established an urban-renewal headquarters in 2001 and enacted the Act on Special Measures Concerning Urban Reconstruction in 2002. The program sought private capital, global competitiveness and the circulation of land stranded as bad debt after the bubble. Around Marunouchi, Roppongi, Shiodome, Shinagawa and Shibuya, redevelopment combined stations, high-specification offices, homes, retail and cultural space. The same year, the law that had constrained new factories and universities in the built-up area was abolished.
The white paper records that Tokyo's nighttime population recovered in the 2000s and that both daytime and nighttime populations rose markedly in the 2010s. Policy now carried two goals at once. National spatial policy promised to correct Tokyo overconcentration. Urban policy promised to strengthen Tokyo's international competitiveness. One tried to guide people and functions outward; the other brought better offices, transport, culture and investment inward.
This is less a policy contradiction than evidence of Tokyo's dual role. Within Japan it is blamed for regional imbalance. In global competition it is defended as the country's largest concentration of talent and capital. The difficulty is that the costs and returns of those two agendas are rarely evaluated on one balance sheet.
The pandemic was not the end of Tokyo
Remote work spread in 2020, and Tokyo's population declined in 2021. Predictions followed that offices would empty, families would relocate and the capital's long concentration would finally dissolve. Digital work did make five-day commuting less necessary. It widened the practical scope for dual-location living, regional entrepreneurship and people who maintain a relationship with a place without becoming permanent residents.
But the flow did not reverse permanently. Tokyo resumed population growth in 2022; social increase in the Capital Region recovered. The Tokyo Area's 2025 net inflow was 123,534, dominated—as it has long been—by people in their late teens and twenties. Starting university and entering a first job are life transitions that are difficult to make fully remote. Young people move not merely toward one vacancy but toward a thick labor market in which a second chance exists.
Video meetings shrink distance, but they do not automatically redistribute recruiters, investors, clients and specialized services. Hybrid work can enlarge the territory from which people commute occasionally, extending the outer edge of the Tokyo Area rather than dissolving it. Digital technology does not make place irrelevant. It rewrites the conditions under which place is chosen.
Why young people—and especially women—choose Tokyo
Japan's Third National Spatial Strategy links correction of Tokyo concentration to making regional communities attractive and open to young people and women. That is a crucial shift away from treating migration as taste. If a region offers fewer specialist careers, lower pay, little opportunity to change employers or advance, or stronger expectations about domestic and community roles, Tokyo can offer anonymity as well as choice.
If policymakers say that young people move because they dream of city lights, the answer becomes an advertising campaign and a relocation grant. If migration is a rational response to differences in job quality, promotion, education, partner choice and the ability to live as a minority, regional institutions and corporate culture must change.
Being chosen as a place to start adulthood is not the same as being an easy place to form a family. In 2024 the total fertility rate was 1.15 nationally, 1.05 in the Capital Region, 1.03 in the Tokyo Area and 0.96 in Tokyo. Fertility is not determined by housing costs alone; age structure, marriage and other factors matter, so simple causality would be misleading. Even so, high housing costs, small homes, commutes, childcare access and the collision of career and family timetables are structural features that cannot be ignored.
- Because young adults move in, birth counts and fertility rates tell different demographic stories.
- The total fertility rate combines age-specific rates observed in one year; it is not the confirmed number of children a real woman will have.
- Housing, marriage, education costs, work, childcare and gender roles must be separated analytically.
- But when the place that attracts young adults makes family formation unusually difficult, the pattern becomes a national demographic problem.
Concentration's largest bill is simultaneous disaster failure
Tokyo's density supports concentrated investment in safety. Seismic buildings, underground flood-control channels, levees, buried utility lines, hospitals, fire services and multiple transport systems are metropolitan strengths. But when damage exceeds those defenses, the simultaneous interruption of government, finance, communications, logistics, corporate headquarters and media magnifies national loss.
The white paper cites a new government scenario issued in December 2025 for a major earthquake directly beneath the capital. Under one specific case—a magnitude 7.3 event beneath southern central Tokyo, in winter, in the evening, with winds of eight meters per second—the estimate is roughly 400,000 damaged buildings, 18,000 deaths and ¥83 trillion in economic loss. It is a conditional scenario, not a prediction, but it conveys the scale at which the benefits of concentration can reverse.
Backing up capital functions requires more than putting servers in a distant data center. Decision authority, skilled people, supplier networks, alternative ports, energy, communications and administrative data must already be capable of operating in other cities. A “second Tokyo” cannot be switched on for the first time after a disaster. Multipolar development is a regional policy, but it is also Japan's national continuity plan.
Strengthen Japan without weakening Tokyo
An anti-concentration policy will fail if it is designed to expel people from Tokyo. Damaging Tokyo's productivity while spreading functions too thinly would make the whole country poorer. The task is to create places outside Tokyo that are not a second-best substitute but a first choice on their own terms.
Tsukuba's experience shows that a real center requires a combination of specialization, employers, higher education, investment, culture, housing and connections. Through February 2026, the tax incentive for strengthening regional headquarters had approved 828 projects. Only 76 were relocation-type projects involving moves from the Tokyo wards; 752 were expansion projects at existing regional bases. Expansion matters, but the figures do not describe a large transfer of command functions out of Tokyo.
Caps on university capacity in the 23 wards, relocation grants, dual-location residence and moves of government agencies deserve a common test. Not how many people moved once, but whether high-quality employment expanded five years later; whether pay, promotion and retention improved for young workers and women; whether a labor market emerged in which people could change employers; whether family formation and life satisfaction changed. Policy should measure an ecology of options, not an entrance count.
The Third Capital Region Regional Plan, decided on June 30, 2026, sets a broad direction for approximately the next decade. Ring roads, airport access, maglev rail, local service areas, dual-location living and digital links can work for concentration or dispersal. If faster transport only brings every region closer to Tokyo, gravity strengthens. If it connects regional companies, universities and culture directly and creates exchange that need not pass through Tokyo, it supports a multipolar country.
The milestones that built a century of Tokyo
1923 The Great Kanto Earthquake. Reconstruction reshapes Tokyo with arterial roads, bridges, parks and land readjustment.
1945 Bombing and evacuation cut Tokyo's population to about 3.49 million. The ambitious war-damage reconstruction plan is later reduced.
1956–58 The Capital Region Development Act and first development plan propose a greenbelt and industrial cities beyond it.
1964 The Tokyo Olympics, Tokaido Shinkansen and Metropolitan Expressway compress the distance between Japan and its capital.
1965–68 The continuous greenbelt is abandoned; the Capital Region expands to Tokyo and seven prefectures.
1970s Tsukuba Science City, Tama, Chiba and Kohoku new towns and northern Kanto industrial areas grow.
1987–88 The Fourth Comprehensive National Development Plan and Multipolar Patterns Act promote business core cities and agency relocation.
1990s The bubble collapses and land prices fall, laying the economic ground for a return to the center.
2001–02 Urban regeneration institutions and deregulation accelerate central redevelopment.
2020–22 The pandemic slows inflow, but Tokyo's population resumes growth.
2025 The Tokyo Area records a 123,534-person net inflow, its third consecutive year above 100,000.
2026 The white paper's “Showa 100” feature reports that the Capital Region holds 35.8% of Japan's population.
Seven tests for turning the white paper into policy
| Question | Measure | Why it matters |
|---|---|---|
| Movement of people | Net migration by age, sex and occupation; retention after five years | A total cannot distinguish education, first jobs and family decisions |
| Movement of functions | Decision rights, R&D, procurement and investment—not only registered headquarters | Moving a sign does not disperse command |
| Regional work | Real pay, specialist jobs, employer choice and women in management | Long-term density of options matters more than a one-off grant |
| Housing and time | Prices, rents, floor area, commute time and childcare access | Shows how the cost of concentration reaches households and family formation |
| Universities | Post-graduation jobs, joint research and startups, not capacity alone | Higher education should be evaluated with its regional employment ecology |
| Disaster redundancy | Time to operate remotely; authority and exercises at alternate sites | A backup building is useless if it cannot make decisions |
| Tokyo's competitiveness | Productivity, international firms, talent, diversity and spillovers | Correction must not weaken both Tokyo and Japan |
Who made Tokyo overconcentration?
No single ministry, company or generation of migrants did. A government racing to reconstruct, corporations placing factories and headquarters, railway groups combining tracks and real estate, suburban municipalities building schools and sewers, and tens of millions of people searching for education and work produced Tokyo's gravity over a century.
Policy repeatedly changed the flow. Factories moved into northern Kanto, national institutes to Tsukuba, housing into three neighboring prefectures and some agencies into business core cities. Tokyo remained the center because individual functions moved while the dense network connecting them often stayed behind.
The “Showa 100” chapter is therefore more than an exercise in nostalgia. Its population curve joins postwar return, the failure of the greenbelt, the triumph and debt of suburbanization, post-bubble reconcentration and a present increasingly supported by international residents. It shows that concentration is not a natural phenomenon. Infrastructure, law, corporate organization and millions of reasonable choices built it. What was built can change—but not through a single subsidy or a single high-speed railway.
The objective should not be to make Tokyo look smaller in a table. It should be to let Sapporo, Sendai, Niigata, Kanazawa, Nagoya, Kyoto-Osaka-Kobe, Hiroshima, Fukuoka, prefectural capitals and specialist industrial cities circulate talent and capital without routing every important exchange through Tokyo. In disaster they should substitute for one another; in normal times they should compete. Japan should preserve both the freedom to come to Tokyo and the freedom to pursue an equally ambitious life without coming.
Tokyo's pull need not stop. Japan needs to create another pull, and then another. The hard lesson of the past hundred years is that this is not the work of erecting a building and calling it a center. It is the work of cultivating a density of choices over a generation.
Reporting note and principal sources
This article uses public information checked through August 7, 2026, 9:02 a.m. JST. The 2026 white paper is the statutory annual report on Capital Region development measures taken in fiscal 2025. We follow its geography and distinguish the Capital Region, Tokyo Area, Tokyo Metropolis and the 23 wards. Population, domestic migration and corporate figures come from sources with different reference dates and coverage; they should not be combined as though they measured the same flow.
- MLIT: Release of the 2026 Capital Region White Paper
- MLIT: Fiscal 2025 Annual Report on Capital Region Development (full report, Japanese)
- MLIT: 2026 Capital Region White Paper overview (Japanese)
- MLIT: Capital Region development and white-paper archive
- e-Gov: Capital Region Development Act (Japanese)
- Statistics Bureau: 2025 Report on Internal Migration in Japan
- Statistics Bureau: Internal migration long-term tables, 1954–2025
- MLIT: Business core city policy
- MLIT: Act for Multipolar Patterns of National Land Use
- MLIT: Third National Spatial Strategy
- Kanto Regional Development Bureau: Third Capital Region Regional Plan
- Tokyo Metropolitan Government: The Urban Development of Tokyo, English edition
- Tokyo Metropolitan Government: Urban development vision