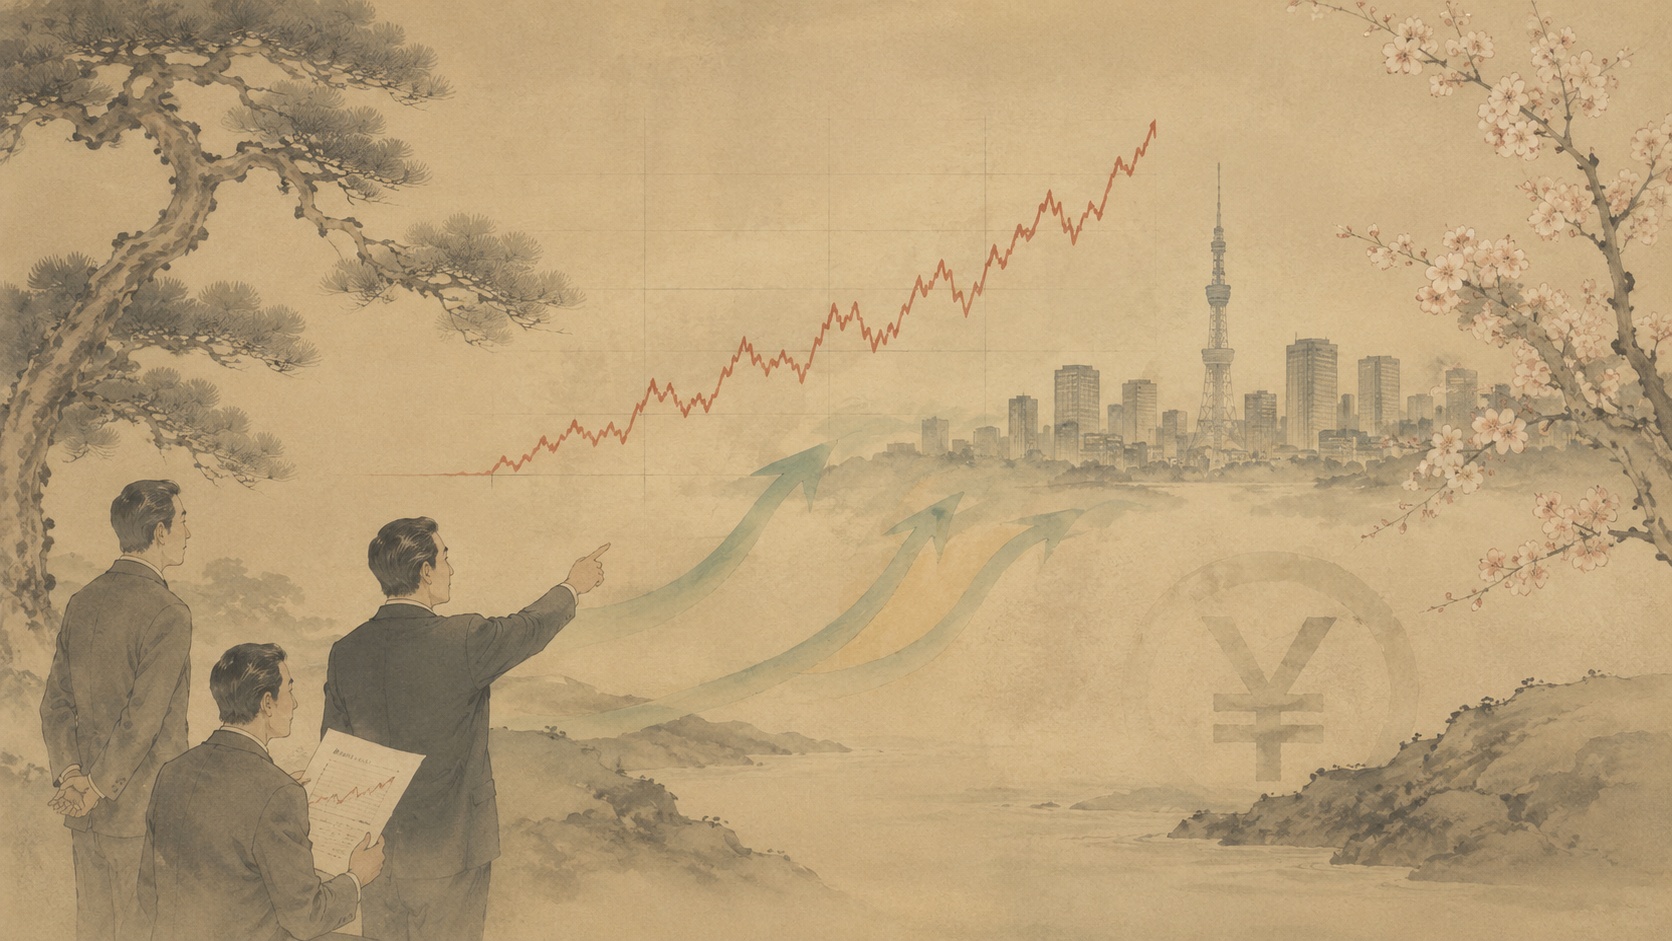
Japan’s benchmark 10-year government bond yield touched 3% on September 1, a level not seen since 1996. It eased back toward 2.97% on September 3 as the global bond selloff calmed, but the significance is larger than a single round number. For the first time in a generation, a Japanese investor can look at a domestic government bond and see a yield substantial enough to compete with overseas debt.
That changes one of the basic assumptions of global fixed income. For decades, Japanese banks, life insurers, pension funds and asset managers operated in a world where safe domestic bonds offered too little income. U.S. Treasuries, European sovereigns and foreign corporate debt became natural destinations for Japanese savings. When the 10-year JGB is near 3% and the 30-year is above 4%, the logic is no longer one-way.
The shift is visible in the primary market. At the Finance Ministry’s September 1 auction, the new 10-year JGB carried a 2.7% coupon and produced a 2.995% weighted-average yield. At the September 3 30-year auction, the coupon was 4.0% and the weighted-average yield was 4.079%. Those are not merely market curiosities. They mark a transition from an era in which domestic sovereign debt was almost income-free to one in which Japanese institutions can earn meaningful nominal returns without taking currency risk.
The reason to buy foreign bonds is getting weaker
Japanese institutions do not compare bonds by headline yield alone. A U.S. Treasury may yield well above a JGB, but an investor whose liabilities are in yen often hedges the dollar exposure. That hedge can absorb a large part of the apparent yield advantage. Funding rates, forward points and cross-currency basis all matter.
A JGB has no such currency mismatch for a yen-based insurer or pension fund. When a 10-year domestic sovereign bond offers something near 3%, and 30-year paper offers more than 4%, the asset can match long-duration yen liabilities while producing income that would once have required a trip abroad.
Reuters, using Japan’s Ministry of Finance weekly international-securities data, reported that Japanese investors had sold a net roughly ¥3 trillion of overseas debt in the year through August 22, the largest year-to-date net reduction since 2022. Weekly flows are volatile, and a few reporting periods do not prove a secular repatriation. What matters is that the interest-rate structure now gives investors a durable economic reason to reconsider foreign exposure.
A 30-year reversal in Japan’s interest-rate history
The weight of the change becomes clearer when set against the post-bubble era. After the collapse of the late-1980s asset boom, the Bank of Japan steadily cut rates as growth weakened and deflation took hold. It introduced a zero-interest-rate policy in 1999 and quantitative easing in 2001. In 2013, the BOJ launched Quantitative and Qualitative Monetary Easing, buying enormous quantities of government bonds. Negative interest rates followed in 2016, along with yield-curve control.
That regime pushed domestic yields to extraordinary lows. Japanese banks struggled to earn spreads. Life insurers and pensions seeking to meet long-term return targets expanded their use of foreign bonds and other overseas assets. Japan’s vast pool of savings became an important source of demand for sovereign debt far beyond its borders.
The reversal began in earnest in March 2024, when the BOJ ended negative rates and returned short-term interest rates to the center of its policy framework. In July 2024 it also announced a predictable reduction in JGB purchases, explicitly stating that long-term rates should, in principle, be formed in markets. The BOJ later noted that as bond purchases declined and policy rates rose, long-term yields became more freely determined; the 10-year yield reached 1.59% in March 2025, then kept climbing.
Policy normalization continued. The policy rate reached 0.75% in December 2025 and 1.0% in June 2026. On July 31 the Policy Board voted 8-1 to keep the overnight rate around 1.0%, while board member Hajime Takata proposed 1.25%. His September 2 speech and press conference in Sapporo reinforced market expectations that further tightening remained possible. The next monetary-policy meeting is scheduled for September 17-18.
1999: Zero-interest-rate policy.
2001: Quantitative easing begins.
2013: Quantitative and Qualitative Monetary Easing.
2016: Negative rates and yield-curve control.
March 2024: Negative-rate policy ends.
July 2024: BOJ sets a plan to reduce JGB purchases.
June 2026: Policy rate rises to 1.0%.
September 1, 2026: The 10-year JGB yield reaches 3%.
GPIF is not proof of a stampede — but it shows the scale
The Government Pension Investment Fund is a useful reality check. At the end of June 2026, pension reserves totaled about ¥320.4 trillion. Domestic bonds accounted for ¥82.0 trillion, or 25.59%, while foreign bonds were ¥78.8 trillion, or 24.60%. Those figures remain close to GPIF’s policy allocation of 25% for each of domestic bonds, foreign bonds, domestic equities and foreign equities.
So the numbers do not support the claim that GPIF has suddenly abandoned foreign assets. But a changing yield environment can alter reinvestment decisions even without a formal change in strategic allocation. Matured bonds, coupon income and new cash all have to be redeployed. A 3% JGB competes very differently from a JGB yielding close to zero.
That distinction matters because giant pools of money do not need to make dramatic allocation announcements to move markets. If domestic bonds receive a little more of the incremental flow month after month, the cumulative effect can become large.
Japan remains one of the world’s great creditor nations
Global markets care because Japan’s overseas balance sheet is enormous. The Ministry of Finance says Japan’s gross external assets reached ¥1,805.6 trillion at the end of 2025, with net external assets of ¥561.8 trillion. Portfolio-investment assets alone were ¥768.7 trillion.
Japan is also a foundational investor in the U.S. Treasury market. U.S. Treasury International Capital data show Japanese holdings of Treasury securities at $1.1167 trillion in June 2026. That was down from $1.1431 trillion in May and $1.2099 trillion in April, but Japan remained the largest foreign-country holder.
This is why “less buying” can matter almost as much as outright selling. Bond prices are set at the margin. If Japanese institutions stop being a dependable source of incremental demand, foreign governments and companies may need to offer slightly higher yields to attract the same capital. A gradual change in Japanese portfolio preferences can therefore tighten financial conditions abroad even without a dramatic repatriation event.
Three percent is income for investors — and a bill for the government
Higher yields have a mirror image. What investors earn, the borrower pays. In the Finance Ministry’s fiscal projections tied to the FY2026 budget, debt-servicing costs rise from ¥28.2 trillion in FY2025 to ¥31.3 trillion in FY2026. Interest payments rise from ¥10.5 trillion to ¥13.0 trillion. The assumed 10-year government-bond rate for FY2026 is 3.0% — essentially the level the market just reached.
Japan’s entire debt stock does not refinance at 3% overnight. The long average maturity of JGBs slows the pass-through. But as old bonds mature and are replaced, the higher cost accumulates. A normalization that restores income to savers can simultaneously reduce fiscal room and raise borrowing costs for households and companies.
Banks and insurers also face a two-sided effect. New bond purchases become more profitable, but old low-coupon bonds fall in market value when yields rise. Institutions that can hold to maturity may ultimately receive par, yet accounting, liquidity and regulatory constraints can make unrealized losses consequential in the meantime.
How a 3% JGB world changes the calculation
| Actor | Low-yield era | Near-3% JGB era | Key risk |
|---|---|---|---|
| Life insurers & pensions | Foreign bonds needed for income | Long yen liabilities can be matched domestically at higher yields | Losses on existing long-duration holdings |
| Banks | Thin income from sovereign portfolios | Better reinvestment yields | Mark-to-market losses |
| Households | Very low returns on deposits and government debt | Safe-asset income returns | Loan rates rise too |
| Japanese government | Huge debt financed cheaply | New and refinanced debt costs more | Less fiscal flexibility |
| Foreign bond markets | Japan a reliable source of demand | Incremental Japanese demand may weaken | Not necessarily a mass selloff |
The stronger yen is part of the same story
The yen surged on September 3, moving back toward the mid-155s per dollar as traders raised the probability of further BOJ tightening and reassessed the U.S. rate outlook. Currency moves have their own catalysts, but the direction of Japanese yields matters for foreign-exchange flows too.
If Japanese institutions need to send less money abroad, there is less structural pressure to sell yen to acquire foreign currency. If foreign bonds are sold and the proceeds are brought home, that can create yen demand. A stronger yen can in turn reduce the yen value of unhedged overseas assets and further change the relative appeal of domestic investments. Rates and currencies are separate markets, but they meet on the same institutional balance sheets.
Why “the great repatriation” is still too strong a phrase
Capital allocation has inertia. Insurance asset-liability management, pension policy portfolios, bank risk limits, credit spreads, hedge costs, regulation and liquidity do not reset overnight. U.S. Treasuries remain the deepest sovereign bond market in the world, and foreign-currency assets provide diversification that domestic bonds cannot replace.
Higher Japanese yields are not purely good news either. They partly reflect inflation pressure, expectations of tighter monetary policy and investor concern over Japan’s fiscal trajectory. A yield is both a return and a price for risk. If fiscal doubts rise, a higher JGB yield can become a warning signal rather than simply an invitation to buy.
The more useful conclusion is about direction. For most of the past three decades, Japanese institutions asked: if there is no yield at home, where should the money go? In 2026, that question is beginning to reverse: do we still need to go abroad?
Four things to watch in September
First is the BOJ meeting on September 17-18. Whether the Bank holds at 1.0% or tightens again will shape the front end of the curve and expectations for the rest of the year. Second is demand at upcoming 10-, 30- and 40-year JGB auctions, which will show whether domestic real-money buyers are willing to absorb supply at these yields.
Third is the Ministry of Finance’s weekly international-securities flow data. A sustained run of net overseas-bond sales would strengthen the repatriation argument; a quick reversal would suggest tactical risk reduction instead. Fourth is the yen and the cost of currency hedging, because the true comparison between JGBs and foreign bonds is the return after bringing that income back into yen.
Three percent is more than a market milestone. It is the point at which Japan’s safe domestic asset has become an investable competitor again. If that level persists, global bond markets can no longer assume that Japan will always export its savings in search of yield.
The money is not rushing home. But after three decades, it finally has a reason to.
Sources and reporting
- Reuters, “How Japan's bond rout is turning the tide of global capital” — September 2, 2026. Reporting on overseas-bond flows and institutional allocation changes.
- Ministry of Finance, Auction Result of 10-Year JGBs on September 1, 2026 — weighted-average yield 2.995%.
- Ministry of Finance, Auction Result of 30-Year JGBs on September 3, 2026 — weighted-average yield 4.079%.
- Ministry of Finance, International Transactions in Securities — weekly resident purchases and sales of foreign securities.
- Bank of Japan, “On the Conduct of Monetary Policy” — July 31, 2026. Policy rate held around 1.0%; board member Hajime Takata proposed 1.25%.
- Bank of Japan, Hajime Takata, “Economic Activity, Prices, and Monetary Policy in Japan” — September 2, 2026, Sapporo.
- Bank of Japan, “Money Market Operations in Fiscal 2024” — history of reduced JGB purchases and freer long-term-rate formation.
- Bank of Japan, Broad Perspective Review of Monetary Policy — official history of zero rates, quantitative easing, QQE, negative rates and yield-curve control.
- Bank of Japan, Hajime Takata speech, February 26, 2026 — confirms the December 2025 move to a 0.75% policy rate.
- Ministry of Finance, Finance Minister Satsuki Katayama press conference, July 10, 2026 — remarks on encouraging Japanese financial-asset investment by households and pension funds including GPIF.
- Government Pension Investment Fund, FY2026 investment results — June 2026 portfolio allocation.
- U.S. Treasury, Major Foreign Holders of Treasury Securities — Japan’s June 2026 Treasury holdings.
- Ministry of Finance, Japan’s International Investment Position at year-end 2025 — gross and net external assets.
- Ministry of Finance, FY2026 medium-term expenditure and revenue projections — debt-service and interest-cost assumptions.
- Bank of Japan publication calendar — September 17-18 Monetary Policy Meeting schedule.
This report is based on public information available by approximately 2:30 AM JST on September 4, 2026. Japanese official names, titles, policy terms and institutional terminology were checked against primary Japanese-language sources from the Ministry of Finance, Bank of Japan and GPIF. The roughly ¥3 trillion year-to-date net sale of overseas debt is attributed to Reuters’ aggregation of Finance Ministry weekly data. GPIF’s actual June allocation is shown to avoid implying that a large-scale repatriation has already occurred. Market yields change daily and may differ by the September 5 publication time.
Image rights: © 2026 Japan.co.jp. AI-assisted editorial illustration. Unauthorized reproduction or reuse is prohibited. For licensing, contact Japan.co.jp.