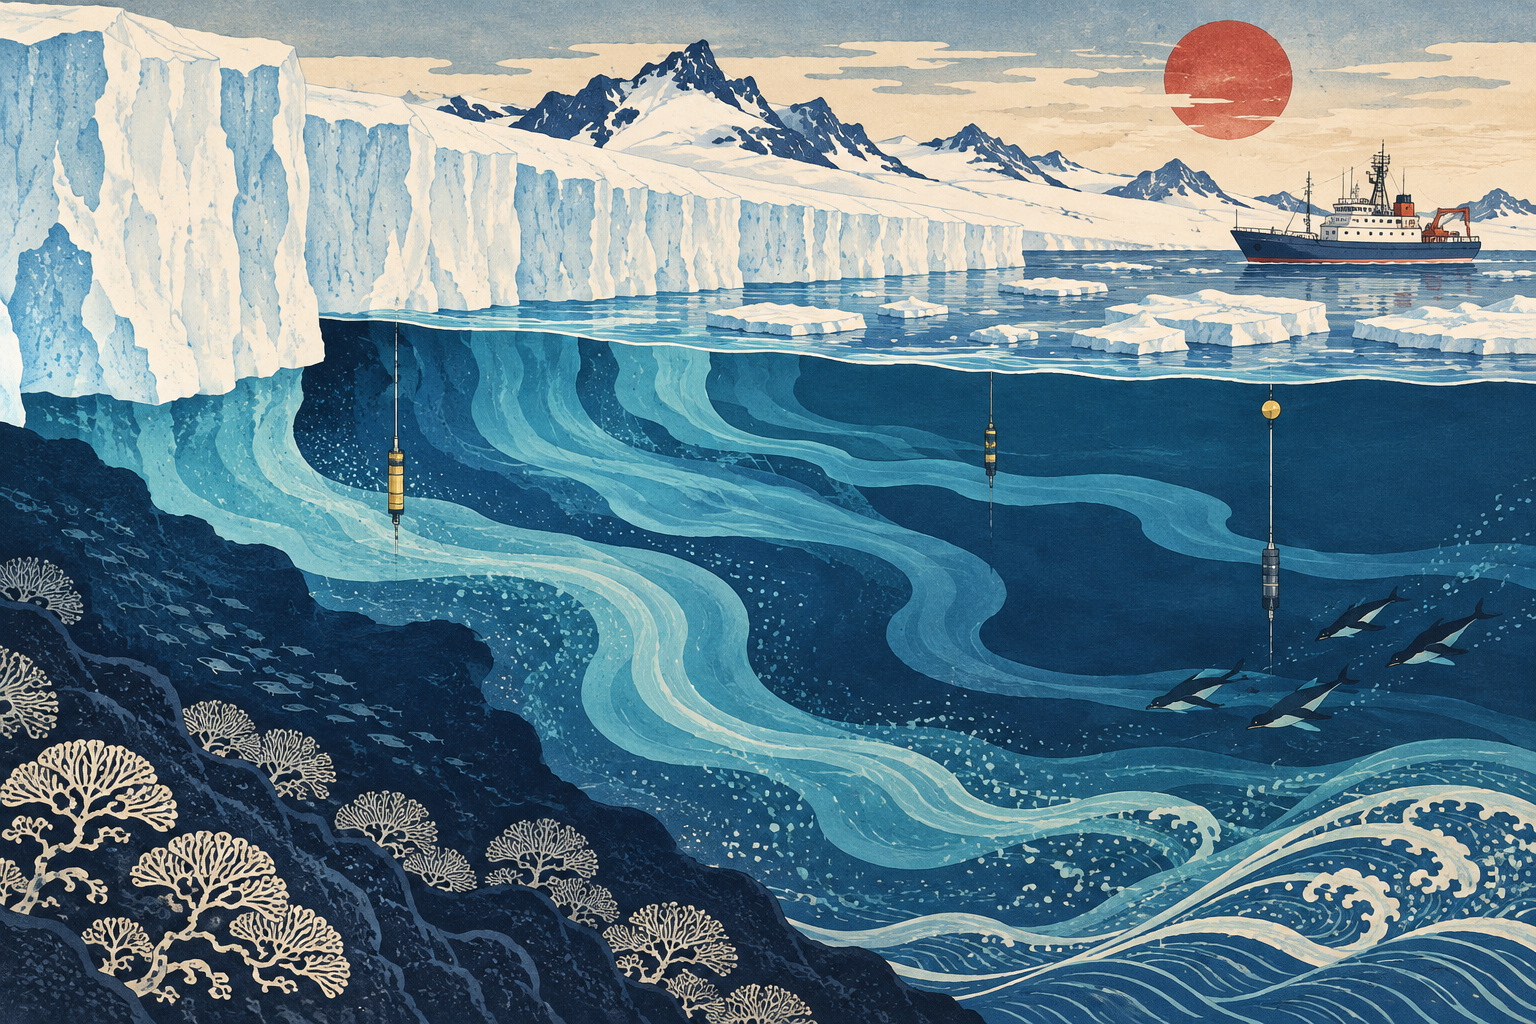
When Antarctic ice melts into the ocean, its story does not end at the ice front. The water mixes into a moving sea. Following it requires a different kind of evidence from measuring the changing outline or thickness of the ice. A Japanese research team has developed a way to reconstruct that submerged freshwater distribution around two East Antarctic ice shelves, using measurements of the water itself.[1]
The work, led by Hokkaido University researcher Yutaka W. Watanabe, concerns the Totten and Moscow University ice shelves. Published in Nature Communications on September 11 and announced by Japanese institutions on September 17, it brings together researchers from Hokkaido University, the National Institute of Polar Research, JAMSTEC and Tokyo University of Marine Science and Technology, among others.[1]
Why the floating edge matters
An Antarctic ice shelf is generally the floating extension of ice flowing out from the continent. Sea ice, by contrast, forms from seawater. Keeping those terms separate matters when reading about meltwater: different kinds of ice can freshen the same ocean, while playing different roles in the wider ice system.[9]
The connection with sea level involves more than melting something that already floats. Ice shelves can restrain the grounded ice feeding them. A 2012 Nature study used satellite laser measurements and modelling to examine thinning around Antarctica, linking increased melting underneath shelves with weaker restraint and faster glacier flow.[5]
This is why a freshwater estimate cannot simply be relabelled a forecast of sea-level rise. The intervening questions concern where thinning occurs and how the connected land ice responds. An ocean measurement helps investigate that chain; it does not settle every link.
First follow the heat
Earlier research around Totten asked how relatively warm deep water reaches the continental shelf. A 2021 study led by Daisuke Hirano combined detailed hydrographic observations with satellite-derived circulation information and identified rotating ocean features carrying warm water toward the shelf break.[4]
The distinction between reaching that boundary and reaching the underside of an ice shelf is important. Heat can be redistributed along the route. The new freshwater work addresses a complementary question: after melting has occurred, where does its influence appear in the surrounding water? In Japan.co.jp’s reading, comparing the incoming heat pathway with the outgoing freshwater signal offers a more demanding test of an ice–ocean explanation than considering either alone.
A chemical clue, with a research history
Salinity records freshening, but cannot by itself identify its source. Rain and melting sea ice complicate the interpretation of water influenced by glaciers. A 2022 Scientific Reports paper developed a way to use dissolved inorganic carbon, or DIC, and routine water measurements to estimate glacier-derived freshening without fixing the chemical properties of each original water source in advance.[3]
Those original properties are known as end members. Imagine trying to work backwards from a mixture when the ingredients themselves vary: assigning one permanent reference value can introduce uncertainty. The earlier research used relationships between ocean chemistry and hydrographic measurements to approach that problem.[3]
The 2026 method combines multiple regression with a neural network. Its inputs include temperature, salinity, pressure and apparent oxygen utilisation, calculated using dissolved oxygen. Separate offshore and coastal estimates of DIC—the combined dissolved carbon dioxide, bicarbonate and carbonate—provide the comparison used to infer the freshwater influence.[1]
The result is a reconstruction, rather than a camera view beneath the ice. That difference is useful, not merely semantic. A reader should ask which quantities were measured, which relationships were estimated, and which conclusion was then drawn from them. “Three-dimensional” describes the distribution being reconstructed; it does not mean every parcel of water was directly tracked.
The observations behind the calculation
The chemistry foundation comes from GLODAP, an international effort to assemble ocean carbon and related measurements into a consistently calibrated resource. Its data products bring together information that researchers can compare across cruises and regions. The specific version used here was GLODAPv2.2023; a newer release should not be silently substituted when describing the study.[1][7]
This infrastructure deserves attention in a story involving machine learning. An algorithm can extract useful relationships only because someone obtained reference measurements, preserved their context and made them usable. The practical question is whether a relationship learned from that record remains dependable when the location, season or instrument changes. That is an argument for continued sampling as well as better computation.
Japan’s contribution has its own long history. The first Japanese Antarctic Research Expedition departed in 1956, and established Showa Station in 1957, during the era of the International Geophysical Year. The programme continued with an interruption; the National Institute of Polar Research’s chronology also records concentrated observations off Totten in 2020.[6]
That history should not be mistaken for a claim that today’s result was inevitable. It explains the institutional groundwork: ships, equipment, field teams and the ability to retain observations for questions that may emerge much later. Scientific innovation can depend as much on keeping a record usable as on devising a new calculation.
Freshwater concentration is not annual discharge
Applied to observations from 2012–2024, the reconstruction showed the freshwater influence weakening offshore from the ice shelves. The depth-averaged fraction near the fronts exceeded two parts per thousand and approached zero around 64° south. Two parts per thousand is 0.2 percent, not 2 percent.[1]
A concentration describes how much freshwater is present in a mixture. To estimate an annual discharge, the study also assumes a representative ocean transport of 1.0 sverdrup—one million cubic metres per second. The table shows why that additional input matters.[2]
| Ice-shelf front | With transport fixed at 1.0 Sv | Including ±20% transport uncertainty |
|---|---|---|
| Totten | 70 ± 7 Gt/year | 70 ± 16 Gt/year |
| Moscow University | 53 ± 9 Gt/year | 53 ± 14 Gt/year |
These are not rival answers. They show the same central estimate with different uncertainty accounting. The wider figures incorporate uncertainty in how much seawater is moving. Reporting only the smaller range would conceal an important part of the calculation.
The distinction also points to a practical research priority. Improving a freshwater tracer cannot, by itself, remove uncertainty in current transport. Measuring the mixture and measuring its movement are connected jobs, with separate requirements.
What a map cannot establish
The paper cautions that sparse observations and sensitivity to how they are grouped prevent a firm conclusion about a persistent long-term increase. Surface estimates also require assumptions about sea ice and precipitation–evaporation effects; a sea-ice correction does not make every freshwater source perfectly separable.[2]
For readers, this creates a useful distinction between evidence of a spatial pattern and evidence of a trend. If observations in two periods sample different places or seasons, the difference cannot automatically be assigned to time. A more detailed reconstruction can improve the questions asked of the record while leaving the record too short or uneven to answer all of them.
The appropriate next step is therefore repeated comparison: similar locations, adequate seasonal coverage, and independent ways of checking the inferred signal. A map becomes a stronger record of change when researchers can return to it with observations that are meaningfully comparable.
Keeping instruments in the water
Argo offers one route toward more sustained measurements. Established in 2000, the international programme uses autonomous floats that drift and move vertically through the ocean. They measure water properties and transmit profiles, complementing what ships and satellites can observe. Data quality control is part of the system, not an optional stage after collection.[8]
Not every Argo float measures oxygen. The biogeochemical extension, BGC-Argo, adds sensors for oxygen and other properties. Its programme explicitly addresses calibration, stability and comparison with shipboard observations. For a method needing oxygen information, the presence and quality of the right sensor matter as much as the number of floats on a map.[10]
Our assessment is that the advance lies in giving existing ocean measurements another carefully testable use. It neither makes fieldwork unnecessary nor turns an incomplete Antarctic record into a complete one. It strengthens the conversation between measurements and explanations: where the ocean brings heat, where freshwater subsequently appears, and whether repeated observations support the same account.
The ice front remains an important boundary. Understanding what happens beyond it requires following the water.
Sources and methodology
Based on Japanese institutional reporting, original research and official observing-programme documentation. Measurements, estimates and Japan.co.jp interpretation are distinguished. The 2012 Nature study is cited from its public abstract.
- NIPR and collaborating institutions: Japanese research announcement, September 17, 2026
- Watanabe et al., Three-dimensional reconstruction of glacier-derived freshwater in East Antarctica using an end-member-independent hydrographic parameterization, Nature Communications (2026), doi:10.1038/s41467-026-77441-z
- Pan, Li and Watanabe, Intense ocean freshening from melting glacier around the Antarctica during early twenty-first century, Scientific Reports 12, 383 (2022)
- Hirano et al., Poleward eddy-induced warm water transport across a shelf break off Totten Ice Shelf, East Antarctica, Communications Earth & Environment 2, 153 (2021)
- Pritchard et al., Antarctic ice-sheet loss driven by basal melting of ice shelves, Nature 484, 502–505 (2012), public abstract
- NIPR: history, organisation and chronology of Japan’s Antarctic research programme
- GLODAP: merged and adjusted data product v2.2023, version-specific archive
- Argo: programme history, profiling floats and data quality control
- National Snow and Ice Data Center: ice-shelf definitions and origins
- Argo: Biogeochemical-Argo mission, oxygen sensors and calibration