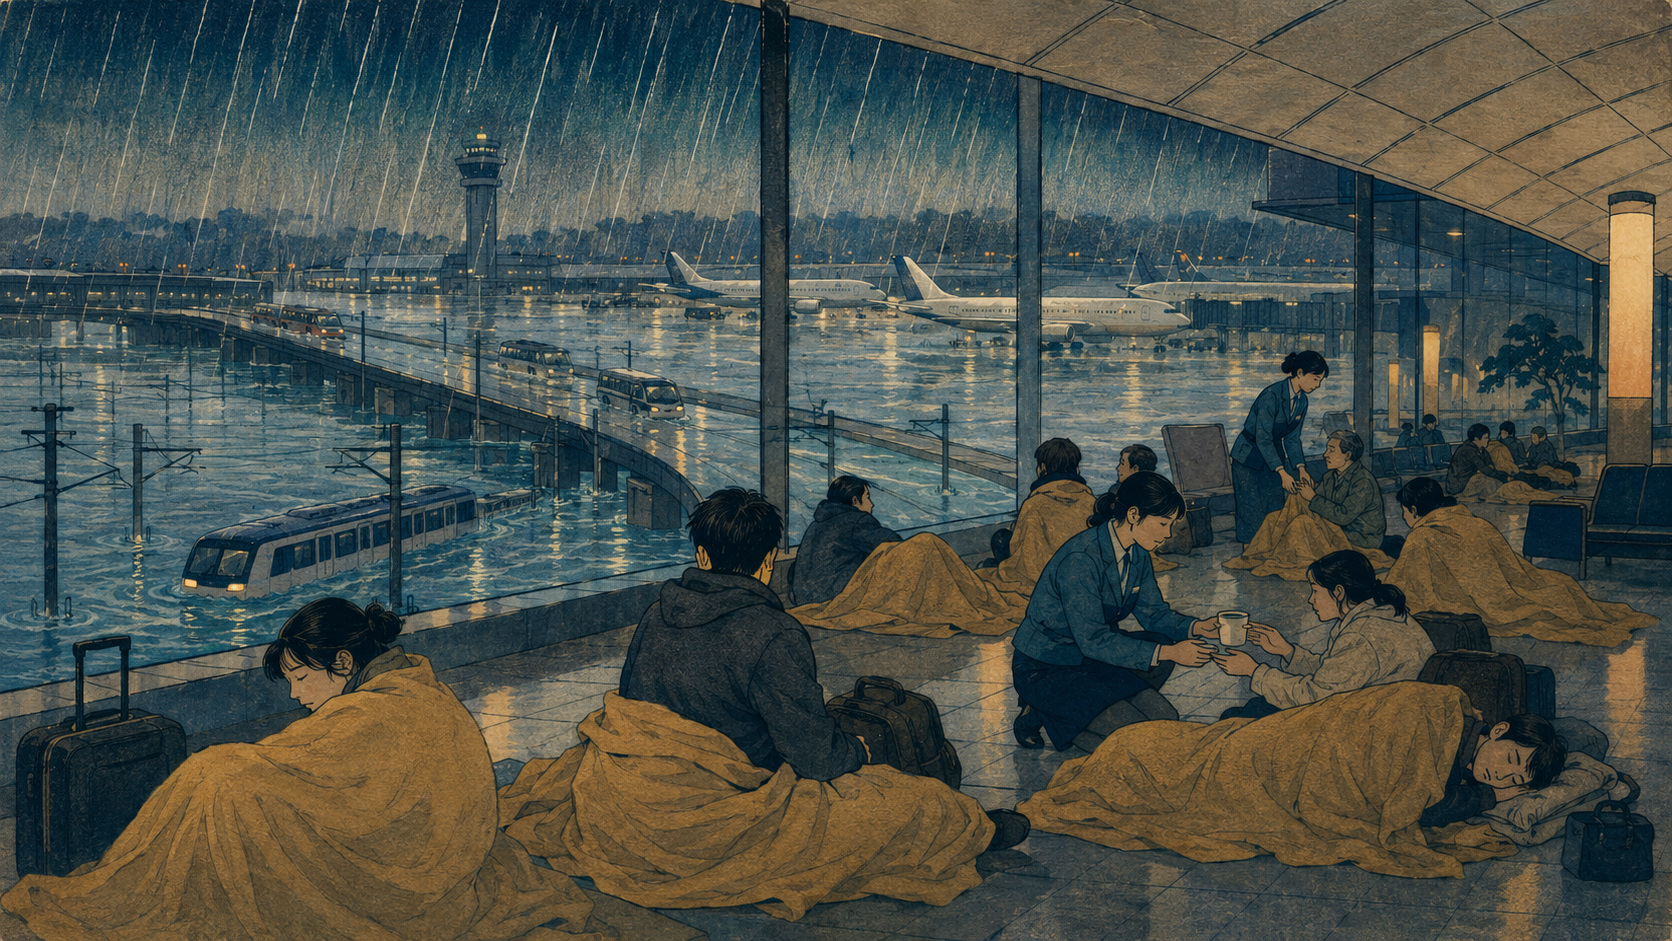
The strangest airport disaster is the one in which the airport still works.
Aircraft crossed the wet runway. Immigration officers processed arrivals. Baggage belts delivered suitcases. Terminal lights stayed on. Yet on the other side of the glass, the system that turns an airport into a gateway had begun to disappear.
Rail services stopped or thinned. Expressways and local roads were flooded, closed or clogged by diverted traffic. Buses could not maintain normal routes. Taxis were scarce; one traveler described a four-hour queue. Hotels filled or became unreachable. Each landing added people to a building that could receive them but could not reliably release them.
By 3:00 a.m. on Friday, August 14, the official count inside Narita was 6,680. Airport workers distributed sleeping bags, water and food. Families lay down on terminal floors during the Obon travel period, when seats, rooms and alternatives were already scarce.
The scene looked like an aviation crisis. Operationally, it was a surface-transport crisis concentrated inside an airport.
The night when the exit stopped
The sequence began on August 13 as cold air aloft met warm, humid air moving around a high-pressure system east of the Kuril Islands. The atmosphere over Chiba became violently unstable. From evening, bands of developed rain clouds repeatedly formed and remained over the same region—the structure known in Japan as a linear precipitation band.
JMA and the transport ministry say record-breaking short-duration rainfall alerts were issued one after another. Chiba City exceeded 360 millimeters in the 24 hours ending at 6:00 a.m. on August 14, more than three times its normal rainfall for the entire month of August and the highest 24-hour total in the local record. Level 5 emergency warnings for heavy rain and landslides were in force across a broad area of the prefecture from 7:30 p.m. until 5:15 a.m.
Water entered roads, railway beds, slopes, substations, pumping facilities and vehicles. By August 15, the ministry was reporting five prefectural rivers with observed inundation damage, landslides along expressways, ballast washed from railway sections and flooding across local roads. The disaster was given an official name within a day: the August 2026 Chiba Heavy Rain.
Narita itself did not need a submerged runway to become isolated. It only needed the paths around it to lose capacity at the same time. People continued to arrive by air while the departure rate by land collapsed. In queueing terms, the terminal became a reservoir: inflow exceeded outflow, and the level rose.
August 13, evening · Repeated linear rainbands form over Chiba; Level 5 warnings spread.
Overnight · Rail, bus and road access is suspended, reduced or heavily congested.
August 14, 3:00 a.m. · MLIT counts 6,680 people stranded inside Narita.
Morning · Keisei resumes reduced service; crowds form for tickets and entry is temporarily controlled.
August 14, 9:00 a.m. · The airport backlog is officially reported cleared.
Why “7,000” is both accurate and incomplete
News headlines used a memorable round number. The official peak snapshot available by the reporting cutoff was 6,680. Both can be honest: “about 7,000” communicates scale; 6,680 preserves the record. Neither tells us how long each traveler waited, how many stayed elsewhere in the airport complex, how many diverted before arriving, or how many employees were unable to reach or leave work.
MLIT’s fourth situation report provides an unusually useful separation. Narita reported no damage to airport facilities that hindered flight operation. It recorded six cancellations and 51 delays of at least one hour on August 13, then 28 cancellations and 96 long delays on August 14, while warning that the counts included causes unrelated to the rain. The disruption therefore cannot be reduced to “the airport closed.” It did not.
The same report says the airport’s stranded population was cleared by 9:00 a.m., six hours after the peak count. That is materially better than a multi-day isolation. It suggests that emergency supplies, crowd management and the first returning transport capacity did useful work. It does not mean the morning was normal. Keisei’s reduced service drew large queues and temporary admission controls; television reporting expected more than 50,000 additional airport users that day as Obon travelers returned.
A disaster count is a photograph, not a film. The resilience question is not simply “How many people slept there?” It is how early the system recognized that arrivals would outrun exits, what decisions slowed that accumulation, how the most vulnerable were cared for, and how quickly safe, understandable routes were restored.
| Claim | What the record supports | What remains uncertain |
|---|---|---|
| “7,000 stranded” | 6,680 people at 3:00 a.m.; reasonably rounded to about 7,000. | Individual waiting times and exact composition of the count. |
| “Narita shut down” | Ground access was severely disrupted. | The airport did not report flight-preventing facility damage; many flights operated. |
| “The crisis ended at 9” | MLIT reported the accumulated airport population cleared. | Congestion, altered trips and wider Chiba disruption continued. |
| “The BCP failed” | The plan’s predicted scenario occurred. | The public documents do not state whether its internal overnight target was exceeded. |
An airport is only as open as its last mile
Aviation statistics encourage a narrow view of an airport: runway movements, cancellations, terminal capacity, on-time departure. For a passenger, the journey begins or ends far beyond the fence. The airport is a node in a system of railways, expressways, local roads, buses, taxis, hotels, power, mobile networks and information.
Narita’s distance magnifies the relationship. It lies roughly 60 to 70 kilometers east of central Tokyo. There is no practical walking fallback. A traveler arriving after immigration with two suitcases, young children or limited Japanese cannot simply move to the next neighborhood and improvise. When high-capacity links disappear, thousands compete for low-capacity substitutes.
The network looks diverse on a route map. JR East’s Narita Express reaches Tokyo, Shinagawa, Shibuya, Shinjuku, Yokohama and Ofuna. Keisei’s Skyliner uses the Narita Sky Access corridor to Nippori and Ueno, while Access Express and Keisei Main Line trains provide other patterns. Highway buses distribute passengers to Tokyo, Haneda, hotels and regional cities. Taxis and private cars use the Shin-Kūkō and Higashi-Kantō expressways plus local roads.
But names are not the same as independence. Rail lines may share low-lying approaches, power supplies, dispatch constraints or downstream interchange stations. Buses, taxis and private cars share road closures and congestion. If the railway fails, demand moves to the highway precisely when the highway has less capacity. The apparent redundancy can become one weather-correlated system.
The airport that opened without a terminal train
Narita’s access problem is as old as the airport. The government decided in 1966 to build New Tokyo International Airport in rural Chiba. Land acquisition and violent opposition delayed the opening until May 1978. By then the airport embodied a national ambition in concrete—but its intended high-speed rail connection did not exist.
The planned Narita Shinkansen was never completed. Keisei extended its railway to the airport in 1978 and began Skyliner service, but the station stood away from the passenger terminal at what is now Higashi-Narita. Travelers transferred to a bus for the final segment. An airport designed for jets had opened with a broken rail last mile.
The inconvenience pushed passengers toward limousine buses and cars. It also fixed an image that would follow Narita for decades: internationally important, geographically distant, and difficult to reach compared with airports whose rail stations sat directly below the terminal.
The solution came through reuse rather than the original megaproject. Underground structures prepared for the abandoned high-speed line were adapted for conventional rail. In March 1991, Keisei trains began running directly to the Terminal 1 station and JR East launched the Narita Express. Terminal 2 received rail service in 1992. A stranded piece of national infrastructure became the spine of two competing airport railways.
That history is encouraging because it shows Japan’s ability to salvage a failed plan. It is also cautionary. Narita’s ground access has often been improved after the airport’s need was already obvious.
Faster trains, wider choices—and the same weather
July 2010 brought the next leap. The Narita Sky Access Line shortened the fastest Skyliner trip between Nippori and the airport to 36 minutes, with trains reaching 160 kilometers per hour. Keisei retained the older Main Line path via Funabashi, creating two route families. JR’s Narita Express supplied direct connections across the Tokyo metropolitan area. Buses filled destinations the railways did not serve.
On an ordinary day, this is genuine choice. One traveler values speed to Nippori; another wants a single seat to Shinjuku; another uses a low-cost train; another boards a bus directly to a hotel. Competition has improved comfort, frequency and price.
During a regional flood, the relevant map changes. A service can be operational at the airport end but blocked farther west. A train may run at reduced frequency yet be unable to absorb an overnight queue. A bus may have an undamaged vehicle and driver but no safe road. Taxis may physically reach the terminal only to spend hours in traffic. Hotels are not access capacity if guests cannot get to them.
On the morning of August 14, the Narita Express was suspended from the first departure, while Keisei’s Sky Access corridor resumed with fewer trains. Sections of the Aqua-Line and Ken-Ō Expressway were closed; by the next morning, MLIT still listed landslide closures on the Chiba-Tōgane Road and Ken-Ō Expressway. The exact affected segments shifted as inspection and repair progressed, but the systemic picture was stable: every substitute was competing with the disaster.
| Mode | Normal strength | Flood vulnerability | Resilience question |
|---|---|---|---|
| JR rail | Direct one-seat rides to major Tokyo and Kanagawa stations. | Track, ballast, signaling, power and connected lines. | Can partial service turn back before damaged sections? |
| Keisei rail | Fast Sky Access plus the older Main Line route. | Shared terminal stations, downstream flooding and crowd limits. | How much independent capacity remains after one corridor fails? |
| Bus | Many destinations; flexible routing. | Road closures, flooded depots, driver availability and congestion. | Are vehicles pre-positioned on the usable side of closures? |
| Taxi/car | Door-to-door and individually flexible. | Very low mass capacity; road and fuel constraints. | Can scarce vehicles be prioritized for those who most need them? |
Faxai was the rehearsal nobody could forget
On September 9, 2019, Typhoon Faxai struck Chiba with destructive wind. Narita’s runway function returned while railways and roads remained badly impaired. Aircraft delivered new passengers into an airport with too few exits. At midnight, 16,900 people were inside; about 13,300 remained overnight.
The resemblance to 2026 is not rhetorical. After Faxai, NAA’s president acknowledged that the airport had prepared for damage to its own basic functions but not adequately for the condition in which the airfield worked and access remained closed. Passengers received water, crackers, sleeping bags and charging equipment, but information was fragmented, shops emptied, and the crowd grew.
The event changed Japanese airport policy. Reviews identified three connected tasks: share information with rail and road operators, communicate in multiple languages, and suppress the stranded population at its source. The last is the hardest. Once people have landed, every solution is a terminal solution. Before they depart another city, an airline can delay boarding, cancel, meter the flow or divert to an airport with functioning access.
Narita revised its business continuity plan in November 2019 and established an integrated emergency organization that brings airport, airlines, government, police, access providers and other operators into a common decision structure. The Civil Aviation Bureau pushed an “A2-BCP” approach: the airport and its many companies should manage disaster continuity as one ecosystem rather than separate firms protecting separate assets.
Faxai also revealed the cost of overcorrection. Before Typhoon Hagibis a month later, landing restrictions reduced terminal accumulation, but aircraft and crews were left out of position and cancellations continued afterward. Resilience is not simply closing early. It is choosing when the damage from continued inflow becomes greater than the network consequences of stopping it.
Narita’s own plan predicted this exact scene
The 2025 public version of Narita’s BCP reads uncannily after the Chiba flood. Its severe-weather scenario includes more than 80 millimeters of rain in an hour or 300 millimeters in 24 hours. It anticipates tunnel flooding, all rail services stopping, ordinary-road regulation, expressway closure and congestion. Then comes the critical sentence: airfield function recovers while airport access remains stopped for a long time, and stranded people are expected.
Chiba City exceeded the plan’s 24-hour rainfall trigger. The airport remained operational. Access collapsed. People accumulated. This was not an unimaginable “black swan”; it was a named planning case.
The plan’s response is sophisticated. It calls for simulation of the stranded population; coordination with the Civil Aviation Bureau on landing restrictions and air-traffic flow; multilingual updates in Japanese, English, Chinese and Korean; free waiting rooms for older people and families with children; supplies, charging and disaster Wi-Fi; and organized passenger routes when trains and buses restart.
For access loss, the published goals are to secure alternative transport within 24 hours and largely restore railways and scheduled buses within 72 hours. NAA is to arrange charter buses before or immediately after the disaster where possible. Access companies and road administrators report damage and restoration forecasts to the joint headquarters.
The existence of this plan changes the question. The fair test is not whether flooding occurred or whether nobody was inconvenienced. It is whether the warning-to-decision chain ran quickly enough, whether the population simulation reflected the suddenness of a stationary rainband, whether transport operators supplied reliable reopening estimates, and whether the landing-flow tools were activated at the right threshold.
- When the Joint Emergency Operation Center was activated and which access operators joined.
- Forecast stranded-person totals at each decision point versus the actual 6,680 peak.
- Whether landing restrictions, flow control or departure-airport requests were considered or used.
- How many emergency buses were requested, secured and able to reach the terminals.
- How often multilingual access and reopening information was updated, and through which channels.
- How many people needing medical, mobility, language or child-care support were assisted.
What worked in 2026—and what still broke
Seven years after Faxai, the scale was smaller: the official peak of 6,680 was less than half the 16,900 midnight count reported in 2019. The backlog was reported cleared by 9:00 a.m., rather than persisting deep into the next day. Supplies were distributed and at least one rail path resumed reduced morning service. These facts are consistent with a better-prepared response.
They do not prove one. The storms differed in track, timing, duration, passenger demand and physical damage. August 2026 came during Obon, while Faxai was a typhoon with extreme wind. Without NAA’s forecasts, activation log, internal target and transport capacity, a smaller crowd cannot be attributed solely to better management.
The clearest success was shelter. People were safer on a lit terminal floor than attempting to cross inundated roads. Flood deaths in Chiba included people trapped in vehicles, and the transport ministry reported a taxi passenger killed after a vehicle was submerged. “Getting everyone out” is not a responsible goal when the outside journey is more dangerous than waiting.
The clearest unresolved problem was flow balance. Normal or near-normal flights can refill a terminal faster than a reduced railway empties it. On Friday morning, resuming service created its own crowd: passengers converged on ticket machines and gates, forcing entry control. The transition from no service to partial service needs queuing plans, priority rules and live capacity information—not just an announcement that a line has reopened.
Information is itself transport capacity. If 2,000 people queue for a train that can take only a fraction of them while usable buses leave elsewhere, the system wastes time and space. A resilient airport must tell a newly arrived traveler not merely which line is “running,” but estimated departure time, queue length, destination, accessibility, last service and the safe fallback if it stops again.
Floods make different networks fail together
Traditional redundancy adds another line or road. Climate resilience asks whether the second option shares the first option’s hazard. Two rail routes are not fully independent if both cross the same storm footprint, depend on flood-prone equipment or funnel into a damaged urban network. Ten bus destinations do not provide ten escape routes if all vehicles meet the same closed expressway.
Engineering can reduce correlated failure. Trackside drainage, raised electrical and signaling equipment, flood doors at tunnel portals, stabilized slopes, pump redundancy and pre-positioned repair materials make individual links harder to lose. Road underpasses and low points need sensors and automatic closure before vehicles enter. Depots and driver-reporting sites should not sit inside the same hazard zone as the routes they are meant to restore.
Operations matter just as much. Buses can be staged outside the forecast impact area. Trains can be planned for short-turn service between the airport and the nearest safe interchange. Mutual-aid agreements can reserve drivers and vehicles. Airlines can include ground-access status in departure decisions. Hotels and public buildings can be assigned as overflow shelters before rooms disappear.
And there must be a safe option to wait. Terminals need water, food, toilets, power, medication refrigeration, quiet rooms, infant supplies and accessible sleeping areas for a crowd lasting longer than one night. The airport’s BCP rightly treats stranded travelers as a population with different needs, not a single count.
The people behind the transport diagram
An airport delay is uneven. A healthy adult with a local phone, Japanese language ability and no immediate obligation may see an uncomfortable night. A traveler using a wheelchair may find an improvised bus inaccessible. A family may run out of diapers or formula. An older passenger may need medicine packed in checked baggage. A visitor without a Japanese payment app may be unable to buy the only available alternative.
International arrivals also begin with an information deficit. They may not know that “service resumed” can mean one reduced-frequency line and a controlled entrance. They may not recognize place names on a diversion notice, understand which terminal a bus uses, or know that a road closure makes a booked hotel unreachable. Their phones may lack a local data connection just when app-based updates become essential.
Narita’s plan specifies four-language communication and the use of public address, digital signs, translators, placards, the airport website, social media and JNTO channels. The redundancy is sensible because no single channel reaches everyone. It should be tested against outcomes: could travelers answer where they could safely go, how long they would wait, and what help was available?
Priority is unavoidable when capacity returns slowly. Seats may need to go first to people with medical or mobility needs, unaccompanied minors, families with infants and those at risk of missing a critical onward connection. A transparent policy reduces conflict. An unexplained queue rewards physical stamina, language skill and the ability to stand for hours.
The 6,680 figure is useful for designing supplies and transport. It should never flatten 6,680 separate journeys into a statistic. Every person had already crossed borders, time zones and bureaucratic gates, only to discover that the final kilometers were the least certain part.
Climate change raises the design rainfall
No responsible analysis can attribute one event to climate change from a headline alone. The August 2026 storm had immediate meteorological causes: cold upper air, abundant warm moisture and persistent organized rain clouds. Event attribution would require a dedicated comparison of today’s climate with a counterfactual climate without human warming.
The planning direction, however, is not ambiguous. JMA’s observations show that very intense rain—thresholds such as 80 millimeters in an hour, 150 millimeters in three hours or 300 millimeters in a day—occurs roughly twice as often as around 1980. Its 2025 national assessment projects that a rainfall event occurring once per century in the preindustrial climate would occur about 2.8 times per century in a world 2°C warmer and about 5.3 times in a world 4°C warmer.
Infrastructure built around yesterday’s return periods becomes less rare-event infrastructure. A drainage system designed for an old “one in 50” storm may meet that loading more than once during its service life. The right response is not to claim every culvert can be made invulnerable. It is to update rainfall assumptions, map compound failures and plan controlled degradation.
Controlled degradation means a flood does not turn a fast 36-minute railway into no information and no exit. It might turn it into an hourly evacuation train to a safe interchange, supported by buses on a separate route and a terminal capable of sheltering the remainder. Performance falls, but the system does not fall off a cliff.
Narita’s BCP already uses 300 millimeters in 24 hours as a severe-weather threshold. Chiba City exceeded 360. The review must ask whether that threshold still provides enough time for decisions—or merely describes the disaster once it is under way.
A bigger Narita creates a bigger obligation
The flood arrived as Japan was planning a much larger airport. Narita handled about 42.6 million passengers in fiscal 2025. The current expansion program adds a third runway, extends another and raises annual movement capacity from 340,000 to 500,000. Government planning materials use a future scale of 75 million passengers and three million tonnes of cargo.
A consolidated one-terminal complex, new rail interfaces and an airport city are being designed around that growth. The “New Narita Airport” concept explicitly calls for multiple access routes, flood-reduction equipment, mode switching, alternative paths and closer restoration coordination. It recognizes that airport access cannot be solved by NAA alone.
August 2026 turns those paragraphs into a design brief. If passenger capacity rises by roughly three-quarters from the 2025 level, shelter, toilets, information systems and emergency surface transport cannot remain sized for today. A runway that can accept more aircraft during a ground-access failure can increase the stranded population faster. Airside capacity and landside escape capacity must be governed as one equation.
The solution is not necessarily one spectacular new railway. It is a portfolio: physically independent rail paths where feasible; flood-hardened approaches; a terminal station able to manage emergency queues; roads with alternate high-ground routes; precontracted buses; interoperable information; and preemptive airline-flow decisions based on real-time ground capacity.
Narita was born with a missing last mile. It repaired that history through the 1991 terminal stations and the 2010 Sky Access line. Faxai then taught that several modern links can still disappear together. The 2026 Chiba flood repeated the lesson in water rather than wind.
At 9:00 a.m., the overnight accumulation was gone from the official count. That is a recovery worth recognizing. The deeper test is whether the number becomes evidence: evidence used before the next terminal is built, before the next 75 million passengers arrive, and before the next band of rain turns an international gateway into an island with working runways.
Reporting notes and principal sources
This article reviews public information available through August 16, 2026 at 6:00 AM JST. Casualty, transport and damage figures were preliminary and may change. The official MLIT report is the controlling source for the 6,680 airport count, 9:00 a.m. clearance, flight-impact caveats and infrastructure status. Historical comparisons do not prove equivalent storm severity or response quality. Resilience recommendations are Japan.co.jp analysis informed by the cited BCP and planning documents.
- MLIT: August 2026 Chiba Heavy Rain situation report No. 4
- MLIT disaster page: reports, road maps and updates
- Choshi Local Meteorological Office: support materials for the August 2026 Chiba Heavy Rain
- JMA: officially named weather disasters, including the August 2026 Chiba Heavy Rain
- Reuters: Narita passengers, rainfall, power and transport disruption
- FNN: Narita Express, Sky Access and expressway operating status on August 14
- TV Asahi: morning crowds and expected Obon passenger flow at Narita
- Narita International Airport BCP, English public summary
- Narita International Airport BCP, Japanese public summary
- Cabinet Office: review of Typhoons Faxai and Hagibis and Narita access lessons
- Civil Aviation Bureau: 2019 airport disaster-management panel discussion
- Cabinet Secretariat: integrated airport disaster measures after 2019
- Narita International Airport Corporation: official airport history
- Keisei Group: 1978, 1991 and 2010 airport-rail milestones
- Keisei: current Skyliner speed, route and frequency
- Narita Airport: current rail routes and terminal connections
- NAA: New Narita Airport concept 2.0
- MLIT: July 2026 Narita expansion and terminal-access plan
- NAA: airport traffic statistics, 1978–2025
- JMA and MEXT: Climate Change in Japan 2025—extreme rainfall observations and projections