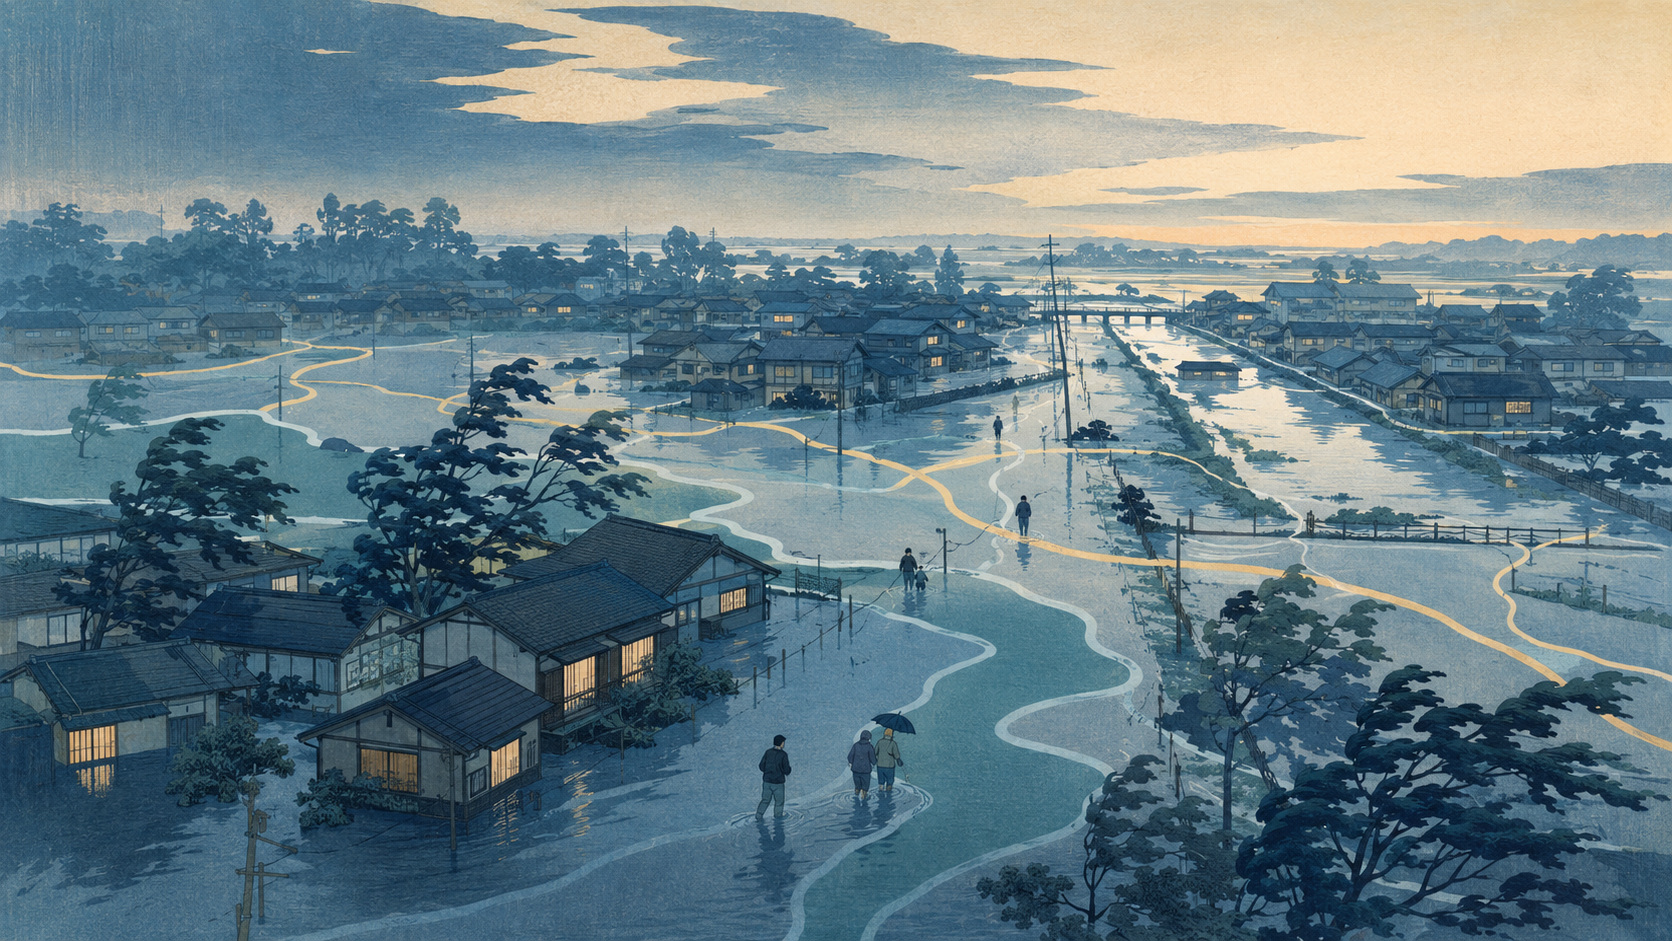
A hazard map asks a family to imagine water before it arrives. The map takes a river, a rainfall scenario, levees, channels and terrain, then turns the calculation into color. Red, pink, yellow or blue means prepare. White is usually read more quietly. It is the part of the page where many people assume the danger ends.
On the evening of August 13, that visual grammar broke down across Chiba Prefecture. Rainwater pooled in streets that had no flood color beneath them. Underpasses became basins. Cars stopped in water far from a visibly overflowing river. Station approaches, commercial floors and ordinary roads were invaded by runoff that had nowhere to go.
Weathernews later placed thousands of citizen reports over several official and observational layers. The result was stark: 55.7% of damage-related reports were outside both the flood-inundation zones and the low-lying areas used in the comparison. In Chiba City’s Chuo and Midori wards, Kashiwa and Yachiyo, the reports described flooded roads, an inundated station rotary, a submerged car and an underpass closed by water. The pattern looked less like a river escaping its banks and more like a city losing the ability to drain itself.
A storm larger than the pipes beneath the street
From August 13 into August 14, a very unstable atmosphere and a band of repeatedly developing rain clouds produced extraordinary rainfall. The Ministry of Land, Infrastructure, Transport and Tourism’s fourth situation report said many Chiba locations received more than 200 millimeters in 24 hours. Chiba City exceeded 360 millimeters—more than three times its normal rainfall for the entire month of August—and set a new observation record.
Weathernews calculated 12-hour totals through midnight of 341.5 millimeters in central Chiba City, 227.0 millimeters in Sakura and 226.5 millimeters in Mobara. In places, hourly rain exceeded 100 millimeters.
That final number explains much of the unmapped damage. A conventional urban drainage system in Japan has often been planned around rainfall of roughly 50 millimeters per hour. When twice that amount falls, water reaches gutters faster than pipes, channels and pumps can remove it. Manholes surcharge. Road crowns redirect flow. Retaining walls and railway embankments create temporary dams. The local high point and low point of a single block can matter more than distance from a river.
River water and rainwater are not the same map
Japanese disaster planning distinguishes between gaisui—external flooding caused when rivers overflow, overtop or breach—and naisui, inland flooding caused when rain cannot enter or move through the drainage system quickly enough. Both can fill a home. Their models begin with different machinery.
| Hazard layer | Primary question | What it can show well | What may remain outside it |
|---|---|---|---|
| River flood-inundation zone | Where would water go if a specified river flooded under a defined rainfall scenario? | Expected depth, duration and destructive flow associated with modeled river flooding | Flooding from another river, local drainage failure, storm surge or rainfall beyond the model |
| Inland-water map | Where could rain collect when sewers, pumps and channels are overwhelmed? | Urban depressions, drainage bottlenecks and surface runoff routes | River breach behavior or conditions beyond the rainfall and infrastructure assumptions |
| Topographic and historical layers | Where has water naturally gathered, and where has it flooded before? | Former channels, low ground, reclaimed land and recurring local trouble spots | The exact course, timing or depth of the next storm |
The distinction is printed in the fine text of official flood maps. Chiba’s maximum-scale inundation map for the Ichinomiya River, for example, explicitly says its simulation does not account for flooding from waterways outside the modeled system, rainfall exceeding the premise, storm surge or inland-water flooding. It warns that flooding can occur outside the colored area and that actual depths can differ.
That is not a legalistic escape clause. It is the mathematical boundary of the product. Every model must define what enters it. Trouble begins when a scenario map is treated as a certificate of safety.
Chiba did not neglect its rivers
The finding is especially important because Chiba had already carried out a large expansion of river-flood mapping. By March 29, 2022, the prefecture said it had designated and published maximum-scale flood-inundation zones for all 211 of the 217 prefecture-managed rivers required under the Water Defense Act. Ninety-one rivers were added in that final round, many of them smaller waterways newly brought within the law’s scope.
The rainfall premise was deliberately severe: a scale derived from the largest observed rainfall in the Kanto region and described at roughly the one-in-1,000 annual-probability scale. Officials also cautioned that “one in 1,000” does not mean a flood arrives on a regular thousand-year schedule. It describes a small chance in any given year.
In the August 2026 disaster, the mapped zones still mattered. Weathernews found strong agreement between known risk and reported damage in places including Ichikawa and Chiba City’s Mihama Ward. It cited major increases in the levels of smaller rivers, and the national government reported confirmed inundation associated with five prefecture-managed rivers as of the morning of August 15.
The lesson is therefore not that the colored areas were imaginary. It is that a correct map of one mechanism cannot be the only map a society reads.
How Japan’s flood maps learned to imagine larger water
Modern flood mapping has expanded in stages, usually after disasters revealed an omission. Japan’s 2005 revision of the Water Defense Act extended inundation-zone requirements beyond major forecast rivers to important smaller rivers and required municipalities to communicate evacuation information through flood hazard maps. The 2015 revision replaced the older planning-rainfall premise with “the maximum scale that can be envisaged” and created formal systems for inland-water and storm-surge inundation zones.
The 2021 revision pushed further into the small-river landscape. Class A and Class B rivers with homes or other assets requiring protection became eligible for designation even when they were not forecast or water-level-notification rivers. Chiba’s March 2022 release was part of that national effort to erase blank spaces.
2005 — Flood-zone and municipal hazard-map duties expanded from the largest rivers toward major smaller rivers.
2015 — The law shifted to maximum-scale rainfall and established inland-water and storm-surge inundation-zone systems.
2021 — Mapping obligations widened to many more Class A and Class B rivers protecting homes and other assets.
March 2022 — Chiba completed maximum-scale river-flood zones for all 211 prefecture-managed rivers then required by the law.
August 2026 — Citizen reports exposed how intense inland flooding could still spread beyond the combined river and lowland layers used in the Weathernews comparison.
A peninsula with several flood histories at once
Chiba’s geography resists a single story. The northwest belongs to the Tokyo metropolitan system, dense with railways, pavement, underground utilities and roads built across subtle low ground. The Tone and Edo river lowlands hold older floodplains and reclaimed wetlands. Along Tokyo Bay, industrial and residential districts occupy coastal terrain transformed over generations. To the east, the broad Kujukuri plain receives rivers descending from the Boso hills. Farther south, short, steep catchments can respond quickly to intense rain.
The Ichinomiya system shows why history matters. The river runs about 30.3 kilometers through a basin of roughly 203 square kilometers. In central Mobara, four tributaries join where the river gradient becomes gentle. Chiba’s own river plan lists major floods in 1989, 1996, 2013 and 2019. The October 25, 2019 rain inundated about 4,000 homes across the basin; the prefecture described it as the fourth major inundation in 30 years. Heavy rain associated with Typhoon No. 13 in September 2023 brought another severe event while improvement works were still under way.
Nor was the 2026 intensity without a distant warning. On October 27, 1999, the Japan Meteorological Agency recorded 153 millimeters in one hour at Sawara, an extraordinary example of how a short burst can overwhelm assumptions built around ordinary rainfall.
Repeated disasters led Chiba toward ryuiki chisui, or basin-wide flood management: not only widening channels and strengthening banks, but also holding water upstream, controlling runoff from development, changing land use, raising vulnerable buildings and planning evacuation across the entire watershed. The approach recognizes that no embankment can manage every drop alone.
The map worked where the river was the danger
There is a temptation after a finding such as 55.7% to declare the old map obsolete. That would discard the other half of the evidence. In recognized inundation zones, the August reports often aligned with the modeled danger. Mihama’s reclaimed low ground remained exposed. Reports from Ichihara and Matsudo described deep inundation and flooded underpasses. River cameras recorded flooding where the lowland or inundation layers had already signaled risk.
A person living inside a colored zone should not read the new analysis as permission to relax. The official zone remains an urgent warning about depth, duration, evacuation difficulty and, in some places, the force capable of damaging a building.
The finding changes the message for everyone else: white space is not an all-hazards zone. It may mean only that the selected river scenario did not paint that pixel.
Twenty thousand reports became a temporary sensor network
Weathernews combined four kinds of information: flood-inundation zones, low-lying-area data, radar-derived accumulated rainfall and citizen damage reports. Its emergency survey gathered 10,009 answers about the highest water level respondents experienced. Separately, 9,938 Weather Reports were submitted from Chiba between 2 PM and midnight on August 13. Comments in the report stream were classified by AI for damage-related language and then compared with the spatial layers.
The method offers something government gauges cannot: thousands of observations at street level, arriving during the event. A river gauge knows the river. A rain gauge knows the rain at one instrument. A driver can report the underpass. A shop worker can report water crossing the threshold. Together they reveal the route between rainfall and lived damage.
But the network has biases. App users are not a random sample of Chiba. People report dramatic scenes more readily than ordinary ones. A location may reflect where a report was sent rather than the precise origin of every drop. AI classification can misread comments. Multiple reports can describe the same incident. The analysis is best understood as a dense map of signals, not an audited count of unique properties.
- “55.7% of damage-related reports” is supported by the published analysis.
- “55.7% of damaged homes” is not established by that dataset.
- The pattern identifies blind spots worth investigation; it does not calculate the future risk of an individual address.
- Combining citizen reports with official damage surveys can improve the next generation of maps.
From one static sheet to a layered risk picture
The next map does not need to abandon color. It needs more layers and clearer language. River inundation, inland water, storm surge, landslides, elevation, former channels, underpasses and past damage can be viewed separately and together. National “multi-stage” maps are also beginning to show more frequent rainfall scenarios, not only the largest imaginable event, so planning can account for both rare catastrophe and recurring disruption.
Municipalities can use the 2026 report cloud to check drainage models against reality. Repeated clusters outside a predicted zone may point to a blocked or undersized culvert, a pump dependency, a road depression, recent development that changed runoff or a small channel missing from the public-facing picture. The highest value of crowdsourced data comes after the storm, when engineers can compare timestamps, photographs, radar and surveyed water marks.
Communication must change too. A legend should tell residents what the map includes before telling them what the colors mean. “River flooding only” should be as visible as the depth scale. A white area should carry an explicit sentence: other forms of flooding may occur here.
How to read a hazard map without asking it to predict everything
The safest reading begins with several questions, not one.
- Which mechanism is shown? River overflow, inland water, storm surge and landslide maps answer different questions.
- What rainfall and infrastructure assumptions were used? Read the explanatory text, not only the colored surface.
- Where does water move locally? Note underpasses, basement entrances, slopes, retaining walls, culverts, former streams and roads lower than surrounding land.
- What happened before? Municipal inundation records and neighbors’ memories can identify recurring trouble that a broad model smooths over.
- Can the evacuation route flood first? A safe destination is not enough if the road to it crosses a river, low bridge or depression.
- What is happening now? Real-time rain, river, warning and evacuation information must override assumptions based only on a pre-event map.
The map is still one of the most useful documents a household can open before a disaster. Its value grows when it is read as a set of modeled possibilities rather than a line between danger and safety.
The white space was never empty
Japan’s flood maps have become broader because each generation learned to see water that the previous system left outside the frame. Major rivers led to smaller rivers. Planning-scale rain gave way to maximum-scale rain. River overflow was joined by inland-water and storm-surge mapping. The August 2026 Chiba reports are another step in that history.
The most important image is not of a map proven false. It is of two maps laid over each other: the official model, built from law, engineering and topography, and the lived map drawn in real time by thousands of people watching water rise.
Where they agree, the warning becomes stronger. Where they differ, the blank space becomes a question for engineers, officials and residents. What filled this road? Where did the water come from? Which assumption stopped at the edge of the color?
Water does not know that a boundary was printed. The purpose of the next boundary is not to promise that water will obey it. It is to help people act before it arrives.
Reporting notes and principal sources
This article reviews public information available through August 16, 2026 at 6:00 AM JST. Weathernews’ 55.7% finding refers to the locations of app-based reports containing damage-related language after AI classification; it is not a verified count of unique damaged households. The national disaster report cited here was the fourth preliminary report, current at 10:00 AM JST on August 15, and its figures may be revised.
- Weathernews: analysis of approximately 20,000 survey responses and field reports from the August 2026 Chiba deluge
- Ministry of Land, Infrastructure, Transport and Tourism: August 2026 Chiba heavy-rain disaster reports
- MLIT fourth situation report, August 15, 2026 at 10:00 AM JST
- Chiba Prefecture: flood-inundation zones and maximum-scale rainfall explanation
- Chiba Prefecture: March 29, 2022 completion announcement for required prefecture-managed rivers
- Chiba Prefecture: detailed maps for smaller rivers
- Chiba Prefecture: Ichinomiya River maximum-scale inundation map and simulation limitations
- MLIT: urban drainage capacity and urban flooding
- MLIT: 2015 Water Defense Act revision and maximum-scale flood, inland-water and storm-surge measures
- MLIT: historical development of inundation-zone requirements in 2005, 2015 and 2021
- Chiba Prefecture: Ichinomiya basin designation and the approximately 4,000 homes inundated in 2019
- Chiba Prefecture: Ichinomiya River basin geography and flood history
- Geospatial Information Authority of Japan: Hazard Map Portal