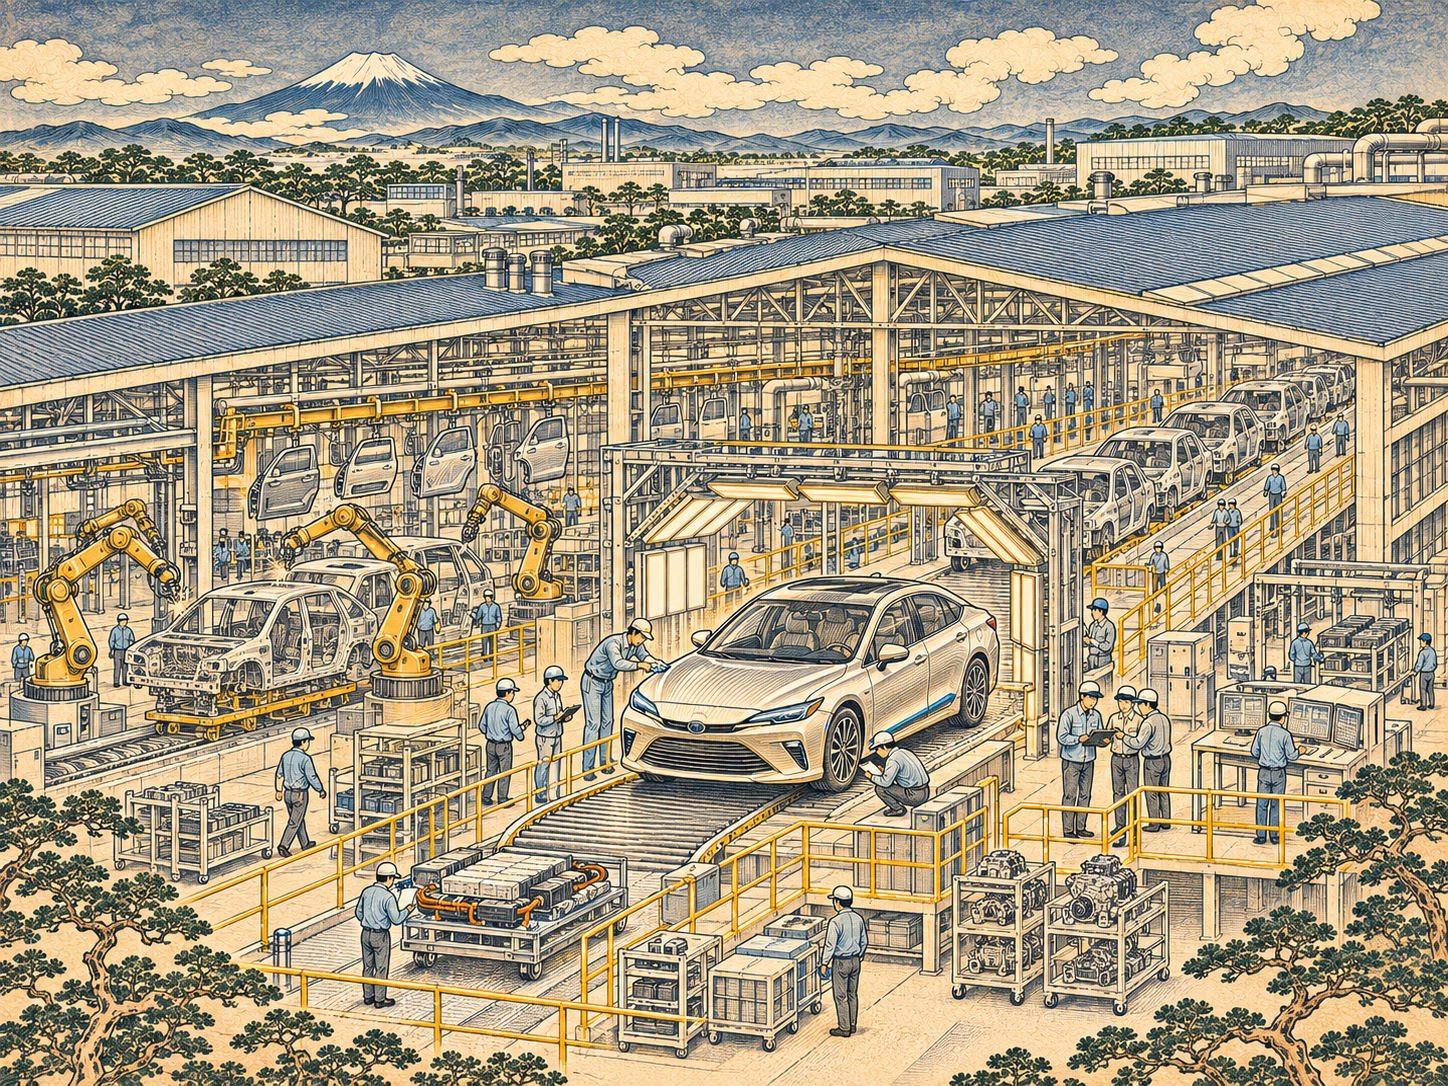
- The profit story is more complicated than a sales chart
- The first-quarter warning beneath a rising top line
- How the Prius became an industrial system
- Not every electrified Toyota is a battery-electric car
- The weaker yen is not a free pass
- North America: a commercially useful middle ground
- China is a different competitive equation
- The capital-allocation dilemma
- Five questions the next financial release must answer
- What a durable competitive advantage would look like
The profit story is more complicated than a sales chart
Toyota has spent nearly three decades making hybrid powertrains ordinary. The business question in late 2026 is whether that engineering advantage can translate into durable margins when currencies, tariffs, regional competition and investment costs are moving in different directions.
The company scheduled publication of its fiscal year ending March 2027 second-quarter figures for November 5 at 1:55 p.m. Japan time. The latest official financial statements verified for this report are the August first-quarter results; Toyota also released April–September production and sales data on October 29. The November earnings outcome is therefore not represented here as an established result.
Instead, the available evidence offers a revealing paradox: revenue was rising in the June quarter while operating profit and margins were falling. This is the pressure that the next earnings release must explain.
The first-quarter warning beneath a rising top line
In the April–June 2026 period, Toyota reported revenue of ¥13.5254 trillion, up 10.4% year on year. Operating profit fell 8.8% to ¥1.063473 trillion. Its operating margin declined to 7.9% from 9.5% a year earlier, even as profit attributable to owners of the parent surged 75.6% to ¥1.477044 trillion.
The contrast is not a contradiction. Operating profit measures the economics of ongoing business activities, while bottom-line profit can reflect important non-operating changes. The company’s first-quarter presentation reported a large increase in non-operating income. Headline net profit alone would misrepresent the underlying automotive story.
At its August presentation, Toyota lifted the full-year operating-profit forecast to ¥3.4 trillion from ¥3.0 trillion, while the preceding fiscal year had produced ¥3.766216 trillion. Whether the company revised that outlook on November 5 requires the new disclosure and cannot responsibly be guessed.
How the Prius became an industrial system
The Prius debuted in Japan in December 1997 as what Toyota described as the world’s first mass-produced hybrid passenger car. That was not simply a new model: it combined an internal-combustion engine, electric drive and sophisticated energy management in a production vehicle that customers could use without external charging.
Toyota’s September 2003 second-generation Prius brought an evolved system known as THS II and the Hybrid Synergy Drive concept. Later the technology spread across numerous vehicles and markets. The key commercial achievement was not just selling one recognizable car but building a reusable base of engineering, production experience, suppliers and controls expertise.
As hybrids became mainstream, their appeal shifted from novelty to practicality. They could improve fuel economy without requiring owners to adopt a charging routine, a consideration that remains significant in markets where charging access or purchase economics discourage battery-electric vehicles.
Not every electrified Toyota is a battery-electric car
Toyota’s category of “electrified vehicles” can include conventional hybrids (HEVs), plug-in hybrids (PHEVs), battery-electric vehicles (BEVs) and fuel-cell electric vehicles (FCEVs). The categories matter: a rising electrified share should not be reported as a rising BEV share.
An HEV captures braking energy and balances engine and motor operation but normally cannot be charged from an external plug. A PHEV has an external charging connection and greater electric-only capability. A BEV runs from stored electricity without a combustion engine. Each entails a different cost structure and customer proposition.
Strong hybrid volumes can support factories, purchasing scale and model pricing. But they do not establish a specific profit per hybrid vehicle. The public numbers need to be read alongside region, product mix, incentives and production costs.
The weaker yen is not a free pass
A weaker yen tends to increase the yen value of foreign-currency revenue on exported vehicles and of earnings translated from overseas subsidiaries. Yet Toyota’s global production footprint, parts sourcing, hedging and financial operations make the net effect more complicated.
Toyota’s official first-quarter presentation showed average rates of ¥160 per U.S. dollar and ¥185 per euro, versus ¥145 and ¥164 a year earlier. Despite that currency tailwind, operating profit declined. In its August full-year bridge, Toyota quantified a ¥715 billion positive currency impact, while identifying other pressures on operating earnings.
The reference quotation of ¥157.94 per U.S. dollar provided for November 5 at 11:55 a.m. JST is a single market observation, not an accounting-period average or Toyota’s forecast assumption. Conflating spot exchange rates and realized company results produces misleading explanations.
North America: a commercially useful middle ground
For Toyota, North America is a region in which many customers still value hybrids for their combination of fuel economy, familiar refueling and broad vehicle choice. That can be an advantage when growth in battery-electric demand or charging infrastructure is uneven.
But profitability is shaped by more than the powertrain. The source of the vehicle and components, U.S. trade policy, local plant utilization, marketing incentives and logistics all matter. Tariff changes can overwhelm the benefit from a favorable model mix, at least for a particular reporting period.
The correct measure is the region’s disclosed earnings bridge, not the assumption that rising hybrid sales automatically offset every tariff or freight cost.
China is a different competitive equation
Chinese automakers are competing on connected features, pricing, battery-electric technology and increasingly sophisticated plug-in hybrids. Toyota must respond to consumers with rapidly changing expectations, often through local production and joint-venture arrangements.
Reuters’ November 4 earnings preview cited softer regional sales and a large year-on-year decline in Chinese volume for July–September, alongside stronger North American electrified demand. Those figures are journalistic reporting and require reconciliation with Toyota’s own categories and geographic tables before being treated as definitive profit drivers.
Volume and operating income do not travel in lockstep. Discounts, local costs, model launches and the accounting treatment of joint ventures can produce very different financial outcomes from similar-looking sales trends.
The capital-allocation dilemma
Toyota cannot finance the next decade by relying on 1997 technology indefinitely. Advanced batteries, digital vehicle systems, factory automation and supplier resilience all demand capital and management attention. They can also raise current expenses before delivering operational benefits.
In August, Toyota discussed hybrid sales, cost improvements and the development of its value-chain businesses while announcing a share repurchase program of up to ¥1 trillion. That combination places investment spending and shareholder distributions in direct view.
Modernizing a factory is not a switch that instantly improves profit. Learning curves, equipment installation, retraining and supplier readiness determine whether greater capital spending eventually produces greater productivity.
Five questions the next financial release must answer
First, did the July–September operating margin recover from the June quarter’s 7.9%? Second, how much of the change came from vehicle volumes and mix, as opposed to exchange rates? Third, what did tariff, material and logistics costs do to the operating-profit bridge?
Fourth, were regional earnings trends in China and North America consistent with their sales trends? Fifth, did management alter full-year expectations, investment plans or the pace of capital returns? Together, these questions form a more useful test than a single percentage increase in profit.
A Reuters survey published November 4 indicated that nine analysts expected roughly ¥992 billion in July–September operating profit, an approximately 18% increase. That is a market estimate—not Toyota’s confirmed result. For publication after November 5, it must be replaced or explicitly contrasted with the actual release.
What a durable competitive advantage would look like
The early Prius made Toyota a hybrid pioneer. The deeper achievement was turning an engineering experiment into repeatable manufacturing expertise and bringing it across an enormous product range. That history still helps explain the company’s position, but history does not settle the future.
Over the next several years, Toyota faces different technology and regulatory choices in every market. Its resilience will depend on providing vehicles customers want while absorbing currency fluctuations, building more capable factories and responding to lower-cost competitors.
The meaningful test is whether operating profits remain strong after temporary exchange-rate gains are set aside. That is the difference between benefiting from the moment and earning a structural advantage. This article is based on published financial and company records and a clearly identified external earnings estimate; the November 5 reported outcome has not yet been incorporated.
Sources and reporting methodology
Document-based reporting based primarily on Toyota’s own financial and sales disclosures, its historical announcements, and clearly attributed external analyst estimates. No independent executive interviews were conducted.
- トヨタ 2027年3月期 第2四半期決算説明会日程(11月5日13:55開示) / official results timetable
- トヨタ 2027年3月期 決算報告 / official investor financial results
- 2027年3月期第1四半期 決算要旨 / Q1 official financial statements
- 2027年3月期第1四半期 決算プレゼンテーション / Q1 presentation
- 第1四半期見通し・為替影響の内訳 / financial outlook and FX factors
- 2026年度上半期 販売・生産・輸出実績 / April–September sales and production
- 2026年3月期 通期決算短信 / previous fiscal-year official statement
- 1997年 初代プリウス発表 / original Prius release
- 2003年 第2世代プリウス発表 / second-generation Prius
- トヨタによる2026年8月の決算解説 / Toyota Times Q1 explanation
- Reuters 2026年11月4日 アナリスト予測 / external analyst estimate