| Measure | October 2026 | Year on year / note |
|---|---|---|
| Exports | ¥11.7688 trillion | +20.5% |
| Export quantity index | 114.4 | +5.8% |
| Imports | ¥12.2453 trillion | +21.6% |
| Import quantity index | 106.4 | −0.2% |
| Trade balance | −¥476.5 billion | Sixth month in deficit |
- Two records, one deficit: Japan’s trade paradox
- What Japan is exporting—and why the AI label needs care
- Shipments rose, but values rose much faster
- Imports tell the other half of the story
- The oil vulnerability has a half-century history
- America: cars, chip tools and a widening surplus
- Asia: an economy of components moving in both directions
- From the postwar export machine to the equipment age
- Why a trade deficit is not the same as national failure
- What to watch after October’s twin records
Two records, one deficit: Japan’s trade paradox
Japan sold more goods abroad in October 2026 than in any month in its modern comparable trade series. It also bought more from overseas than ever before. The result, reported by the Ministry of Finance on November 18, was a ¥476.5 billion merchandise trade deficit—an unusually revealing snapshot of a country deeply embedded in the world economy.
Exports reached ¥11.7688 trillion, up 20.5% from October 2025. Imports climbed faster, rising 21.6% to ¥12.2453 trillion. Both were monthly records in the official ranking extending back to January 1979. The deficit was the sixth consecutive monthly shortfall and was 57.8% wider than a year earlier.
The numbers invite a tempting story: Japanese factories are winning an AI-driven export boom while expensive oil wipes out the gains. Parts of that story are true, but the details are more interesting. Automotive exports and machinery mattered alongside semiconductors, and changes in exchange rates and import prices complicate any easy conclusion about economic strength.
What Japan is exporting—and why the AI label needs care
The strongest export categories cited by the ministry included automobiles, electronic components such as semiconductors, and semiconductor-manufacturing equipment. Their year-on-year value increases were 19.9%, 49.7% and 49.7%, respectively. Electronic-component exports were approximately ¥929.6 billion and semiconductor-equipment exports approximately ¥544.2 billion.
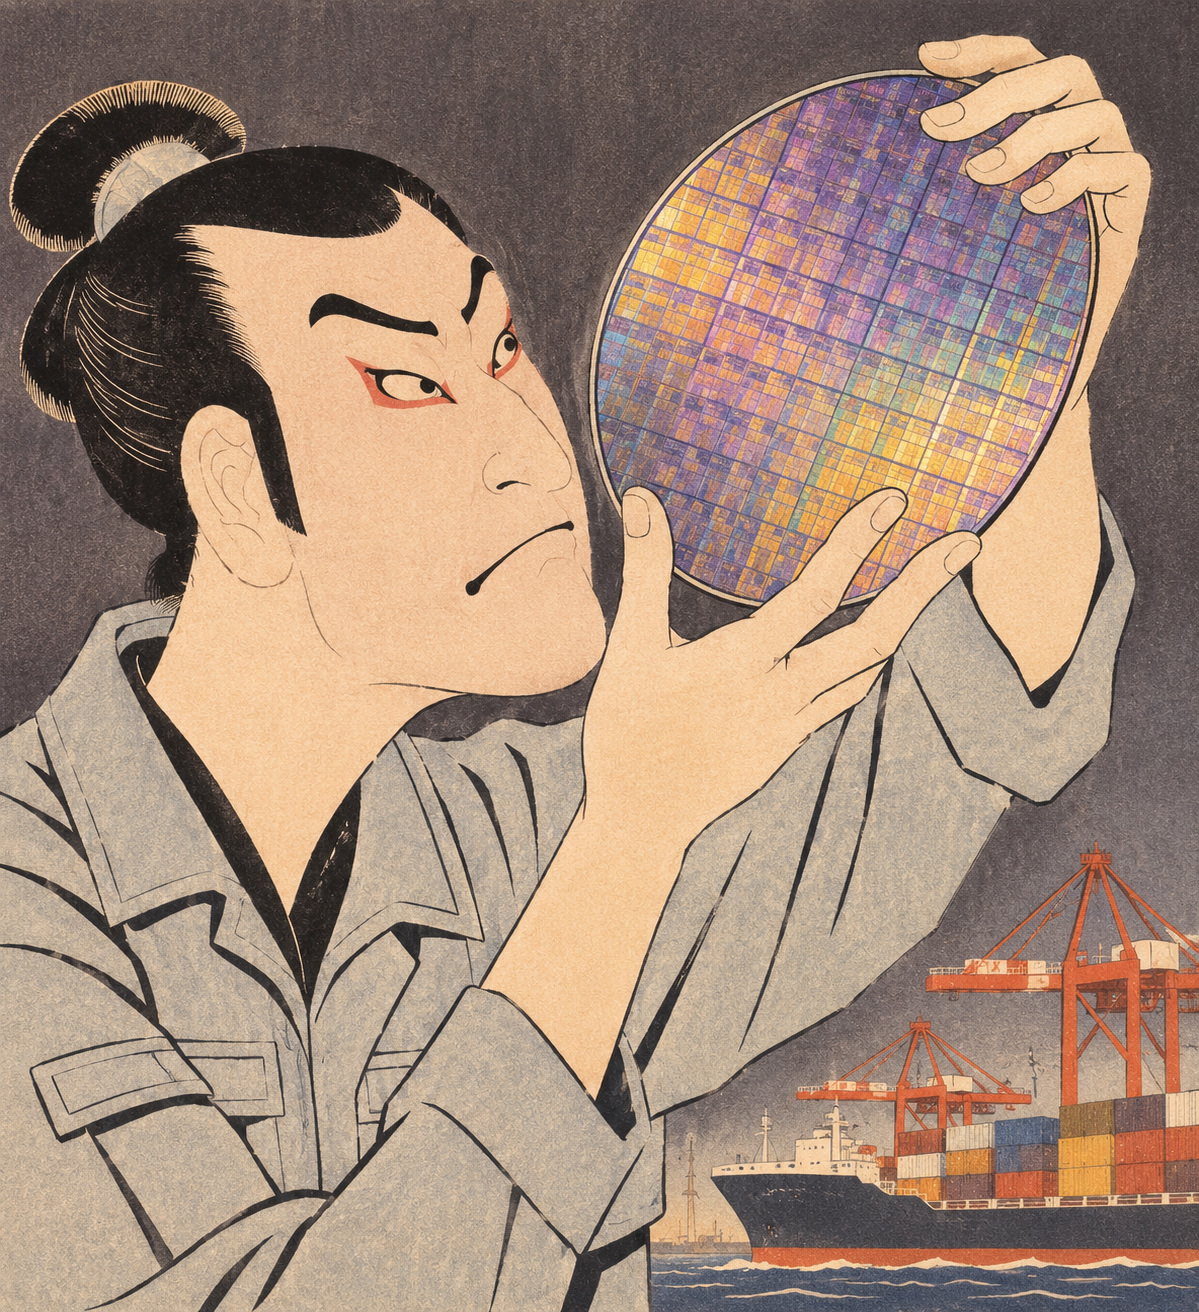
The surge fits a world investing heavily in computing hardware. Japan is an important source of equipment and components used by factories elsewhere in Asia and beyond. Yet Japan’s customs classification does not isolate chips or tools destined specifically for artificial intelligence. Some goods serve smartphones, vehicles, industrial controls and other applications. It would be misleading to assign the entire increase to AI.
The more useful insight is about industrial position. A country need not dominate finished consumer electronics to be consequential in making the machinery and components that another country uses to produce them. Japan’s technology footprint is often in the middle of the supply chain, not necessarily on the label of the final device.
Shipments rose, but values rose much faster
The ministry’s export quantity index increased 5.8% from a year earlier, its eighth consecutive month of year-on-year growth. That supports a real increase in shipments, but the much larger 20.5% growth in yen-denominated export value also reflects price, product mix and currency effects. The quantity index is a statistical construction rather than a simple count of boxes leaving Japanese ports.
The monthly average customs exchange rate was ¥157.84 per U.S. dollar, compared with ¥149.51 a year earlier—a 5.6% weakening of the yen. When receipts are expressed in yen, foreign-currency transactions can look larger without an equivalent change in their foreign-currency value. It is not valid to subtract 5.6 percentage points mechanically from export growth and declare the remainder “real” growth.
Seasonally adjusted export value was ¥11.1227 trillion, up 3.3% from September. That is a different comparison from the headline year-on-year change. Both help investors distinguish the latest monthly momentum from the underlying comparison with 2025.
Imports tell the other half of the story
Import values rose 21.6% despite a 0.2% decline in the import quantity index. It was the second consecutive year-on-year contraction in that measure. This divergence is why the headline deficit cannot be explained simply as Japanese consumers suddenly purchasing far greater physical volumes of foreign goods.
Crude petroleum imports rose 60.5% in value, semiconductor-related electronic components rose 60.0%, and computers and peripheral devices rose 52.7%. Japan was paying more for essential energy and electronics at the same time that its companies were selling advanced goods abroad.
The overall quantity decline points toward a role for prices and mix, but does not establish a precise decomposition. Identifying how much of the energy bill came from price, shipping routes or physical quantities requires product-level data not resolved by the headline summary alone.
The oil vulnerability has a half-century history
The petroleum shock of 1973 helped reshape Japanese energy planning. Conservation, diversification, reserves and security of supply became enduring policy priorities. More than fifty years later, Japan still relies on imports for nearly all fossil fuels. A May 2026 government briefing put the Middle East share of 2025 crude imports at 94%, with 93% passing through the Strait of Hormuz.
Japan has pursued alternative suppliers, and the October trade release shows a sharp increase in the value of crude imports from the United States. But a high percentage increase can begin from a small base, and one month of purchases does not prove that a new long-term supply network has replaced the old one.
This is what makes the record import bill economically consequential. The same global connections that enable Japan to export high-value manufactured equipment expose households and companies to sudden changes in energy costs. Industrial success does not eliminate geography.
America: cars, chip tools and a widening surplus
Exports to the United States reached ¥2.1739 trillion, a 23.9% increase. Japanese automobile exports to the U.S. market grew 37.2% in value, while semiconductor-manufacturing equipment surged 118.5%. Imports from America were ¥1.4834 trillion, up 19.7%. Japan’s bilateral goods surplus widened to ¥690.5 billion, up 34.1%.
It is important not to confuse bilateral balance movements with a full evaluation of trade policy or profitability. Currency conversion, product mix, delivery schedules, tariffs and Japanese production inside the United States can all alter what appears in customs data. Major equipment deliveries may also produce sharp monthly swings.
What the October figures demonstrate is the breadth of Japan’s industrial links with the American economy: vehicles remain a pillar, but the tools used to build the next generation of computing systems are another.
Asia: an economy of components moving in both directions
Exports to Asia increased 22.0% to ¥6.4105 trillion. Electronic components such as semiconductors rose 52.6%, and semiconductor-manufacturing equipment increased 41.1%. Imports from the region also accelerated, up 23.2% to ¥6.2222 trillion, including a 61.9% rise in semiconductor-related electronic components.
That two-way growth is consistent with a regional industrial system in which design, materials, fabrication, assembly, testing and integration are distributed across borders. However, the aggregate customs figures do not trace a specific wafer or component through successive transactions. They show parallel movements, not proof of a particular round trip.
China illustrates why regional averages can mislead. Japan’s exports to China rose 13.3%, even as automobile exports to China fell 53.3%. Imports from China grew 14.7%, leaving a ¥905.3 billion bilateral deficit. The destination and product matter as much as the total.
From the postwar export machine to the equipment age
Japan’s economic identity was shaped by the rise of manufacturing exports—first textiles and other goods, then cars, electronics and industrial machinery. The trade disputes of the 1980s made Japan’s export strength a global political issue. But international production has evolved: companies now build abroad, outsource some stages and sell specialized tools or materials rather than only finished goods.
Ministry of Finance annual figures also show how the balance can shift. Japan registered a merchandise deficit in 2011, and in 2022 imports substantially exceeded exports amid volatile global energy costs. The historical series offers a warning against treating a single monthly surplus or deficit as a permanent national identity.
October’s record should therefore not be mistaken for a return to an earlier era in which finished Japanese products alone drove the trade story. This is a different industrial landscape, where intermediate goods, production equipment, cross-border investment and energy purchases all count.
Why a trade deficit is not the same as national failure
Merchandise trade is one part of the balance of payments. Customs figures do not directly include revenue from tourism, services, dividends on overseas assets or other primary income. Japan can run a monthly goods deficit without necessarily running a current-account deficit. Conversely, a goods surplus would not automatically guarantee rising household living standards.
Imports also have economic uses. Semiconductor tools, components and industrial materials can sustain future output; energy keeps transport, manufacturing and households functioning. Yet rising import costs can still compress margins and increase the pressure felt by consumers and utilities.
The responsible reading looks beyond a single score: export volumes, import prices, exchange-rate effects, capital spending, corporate profitability and the service balance together form a more informative picture than merchandise trade alone.
What to watch after October’s twin records
The next scheduled preliminary release for November trade is December 16, according to Japan Customs. Analysts should watch whether export quantity continues to rise, whether semiconductor-tool orders and car shipments remain broad-based, and how oil and currency conditions affect import costs.
The seasonally adjusted October goods balance was a deficit of ¥767.2 billion, different from the unadjusted ¥476.5 billion shortfall. That difference is a reminder that headline records and month-to-month momentum answer different questions. Preliminary figures are also subject to revision.
The most revealing fact is not that Japan’s exports reached a record or that it recorded another trade deficit. It is that both occurred together. A highly capable export economy remains dependent on imported fuel, components and foreign markets. Japan’s challenge is to turn more of that international activity into durable productivity and resilient incomes while remaining exposed to the price of everything it must buy.
Primary sources and reporting limitations
This original report is based on Ministry of Finance preliminary trade data released November 18, 2026 JST and historical government energy sources. We conducted no direct interviews. The figures do not isolate AI-specific chip shipments, quantify each oil price effect, or establish firm-level profits. Later revisions and announcements are not reflected.
- Ministry of Finance, October 2026 preliminary trade statistics, released November 18
- Japan Customs / Ministry of Finance, trade statistics portal and release calendar
- Ministry of Finance, annual export and import totals since 1950
- Japan Customs: historical trade by region and principal goods
- Agency for Natural Resources and Energy, Energy White Paper 2025
- Agency for Natural Resources and Energy, resources and fuels briefing, May 2026