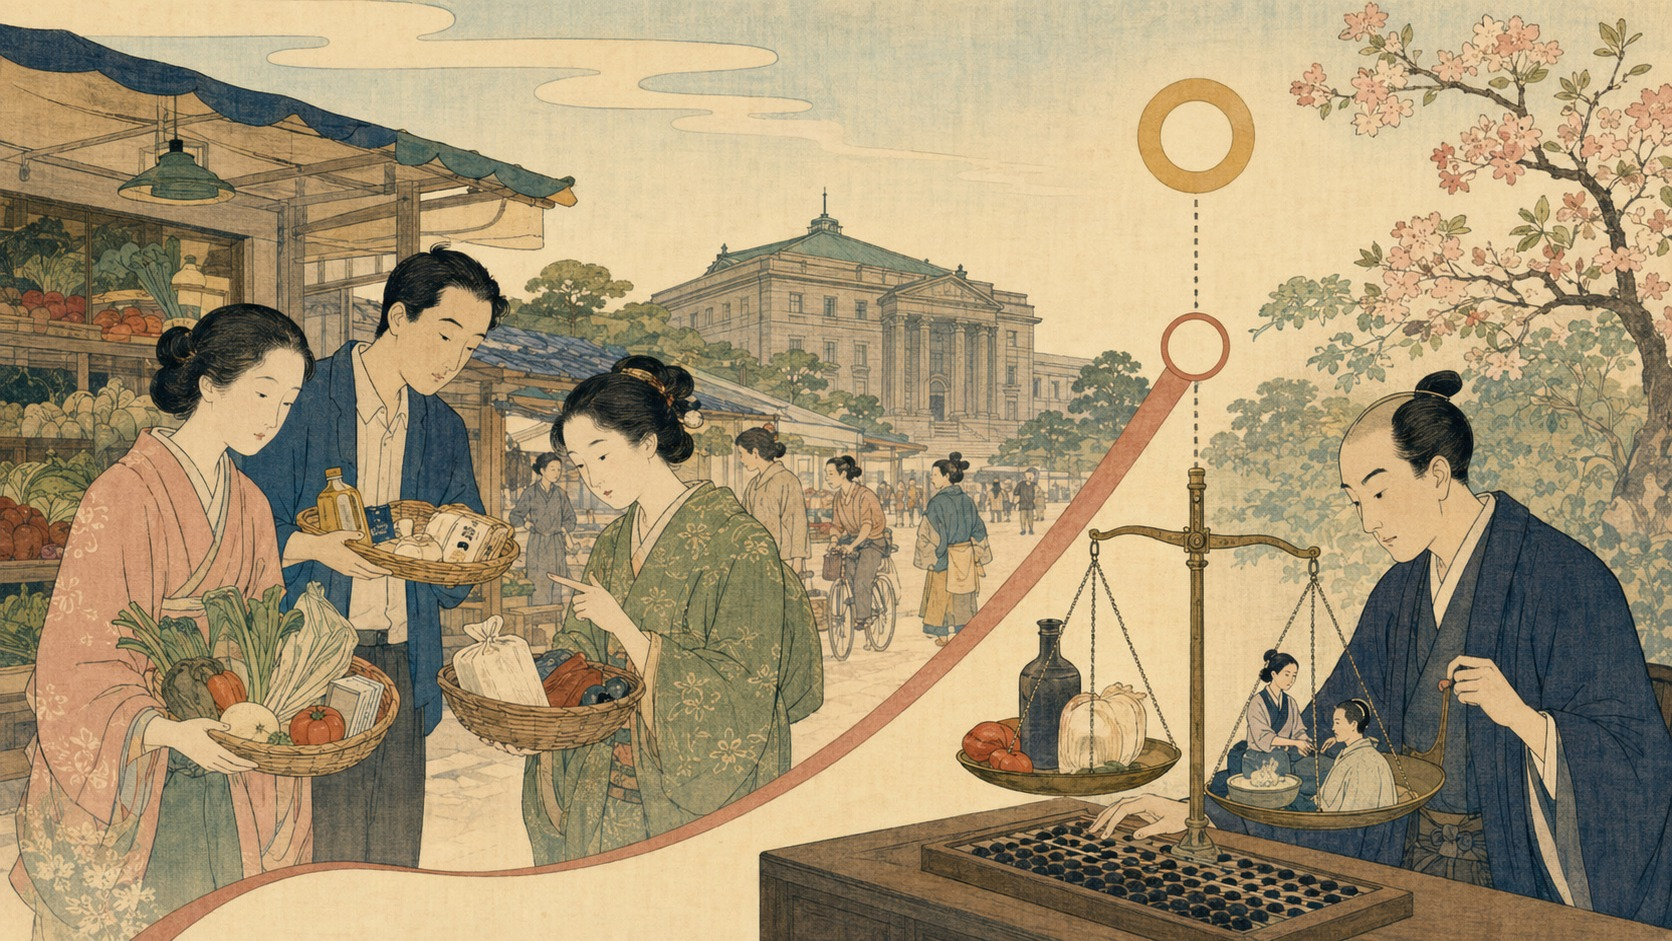
The price of a prepared lunch box rose 10.6% from a year earlier. Chocolate was up 8.8%, coffee beans 23.3% and tuna 17.9%. Yet Japan’s closely watched “core” inflation rate was only 1.6%—below the Bank of Japan’s 2% target for a fifth consecutive month. Read in isolation, the number suggests that the cost-of-living shock is fading and the central bank has little reason to hurry. The experience of households is not so simple.
The Statistics Bureau’s July 24 release showed that nationwide consumer prices rose 1.7% in June 2026. The index excluding volatile fresh food—the measure commonly called core CPI in Japan—rose 1.6%. The index excluding both fresh food and energy rose 1.7%. Core inflation accelerated from 1.4% in May, but remained below 2% from February through June. The fresh-food-and-energy-excluded measure, often called “core-core,” declined every month from 2.6% in January to 1.7% in June.
The acceleration in the headline core rate did not mean that a new wave of demand inflation suddenly spread across the economy. Energy prices fell just 0.1% from a year earlier in June after dropping 2.5% in May. That fading drag added 0.20 percentage point to the change in core inflation. By contrast, inflation in food excluding fresh items slowed from 3.5% to 3.1%. The surface moved up while acceleration and deceleration crossed underneath.
Three inflation rates in the same month
There is no single inflation rate. Headline CPI covers the broad basket of goods and services purchased by households. Fresh food is unusually sensitive to weather, so Japan’s standard core measure removes it. A further index strips out both fresh food and energy, making it useful for international comparison and for examining whether inflation has spread beyond the most volatile costs.
| June 2026 measure | Year on year | May | What it reveals |
|---|---|---|---|
| All items | 1.7% | 1.5% | The broad household picture, including fresh food and policy-sensitive energy |
| All items less fresh food | 1.6% | 1.4% | Japan’s standard core measure and the focus of BOJ forecasts |
| Less fresh food and energy | 1.7% | 1.8% | One window on whether inflation is becoming embedded in services and other goods |
| Food less fresh items | 3.1% | 3.5% | A frequently purchased category that weighs more heavily on lower-income households |
| Energy | −0.1% | −2.5% | A policy-sensitive mix of oil, currency, taxes, subsidies and base effects |
All three broad measures below 2% confirm that the earlier inflation surge has cooled. But calling the result a simple “miss” of the BOJ’s target can misdescribe the policy framework. The formal target is a 2% year-on-year rise in the CPI. It is not an automatic instruction to raise or cut rates whenever one monthly exclusion measure crosses a line.
Five months below 2%—and a possible turn from the bottom
Core CPI was 2.0% in January, 1.6% in February, 1.8% in March, 1.4% in April, 1.4% in May and 1.6% in June. February through June make the five-month run. Headline inflation remained within a 1.3% to 1.7% range over those months, while inflation excluding fresh food and energy fell in a straight line from 2.5% to 1.7%.
The key to June’s core acceleration lies not only in prices that rose, but in prices that fell less rapidly than a year earlier. Gasoline shifted from a 7.0% year-on-year decline in May to a 0.7% decline in June. Electricity moved from a 2.4% fall to a 1.7% fall. Kerosene accelerated from 12.4% to 16.5%. Energy’s contribution to the headline rate changed from minus 0.20 percentage point to minus 0.01.
This is a base effect. A price need not surge this month for its annual rate to change sharply; the comparison month a year ago may have been unusually high or low because of a subsidy, tax change or commodity shock. It is one reason a central bank cannot steer by a single year-on-year reading.
The visible inflation created by subsidies and taxes
The Statistics Bureau estimated that the abolition of the provisional gasoline tax rate and other policy measures reduced June headline CPI by 0.74 percentage point: 0.62 point through gasoline and 0.12 through kerosene. It would be wrong simply to add the figure and declare that inflation “really” was 2.44%; demand responses, substitution, corporate pricing and rounding prevent that mechanical conclusion. It is nevertheless clear that policy design materially shaped the reported 1.7% rate.
Education offers another example. Private high-school tuition was 68.8% lower than a year earlier, subtracting 0.18 percentage point from headline inflation. The relief is real for an eligible household. For monetary policy, however, a one-time institutional reduction must be separated from a sustained decline caused by weak demand.
Slower food inflation does not mean cheaper food
Inflation in food excluding fresh items slowed from 3.5% to 3.1%. That means prices rose more slowly than before—not that the level fell. With 2020 equal to 100, the broad food index stood at 128.6 and food excluding fresh items at 129.3. The latter was almost 30% above its base-year level.
The detailed basket shows the lived experience: prepared lunch boxes up 10.6%, chocolate 8.8%, coffee beans 23.3%, tuna 17.9% and domestic pork 5.3%. Home-maintenance services rose 3.6%, voluntary motor insurance 5.3%, mobile-phone service 4.6% and lodging 3.1%. An average can be 1.7% while unavoidable or frequently purchased items rise much faster.
CPI weights approximate the spending of a representative household. A lower-income family devoting more of its budget to food, a rural household dependent on a car, and an older household using more medical and care services experience different personal inflation rates. Distribution matters alongside the precision of the national average.
The 2% target is neither a ceiling nor a one-month pass mark
The BOJ established a 2% price-stability target in January 2013. The purpose was not to make things expensive. When prices keep falling, households can defer purchases, companies struggle to raise prices, wages or investment, and the real burden of debt rises. A small, durable positive rate also gives the central bank room to reduce nominal interest rates in a downturn.
Two percent is a medium-term objective to be achieved sustainably and stably, not a ceiling. If oil briefly pushes CPI to 3% while wages and demand remain weak, the BOJ need not regard that as durable achievement. If a subsidy pulls monthly core CPI to 1.6% while wages, expectations and service prices continue toward 2%, the Bank need not stop normalization.
The BOJ’s March 2026 review of underlying inflation explicitly says that no single indicator can determine the trend. It groups its evidence into measures that remove volatile items, measures of medium- to long-term inflation expectations, and model-based estimates. June CPI is important evidence. It is not a verdict.
From the inflation of the 1970s to 25 years of deflation
Japan’s modern memory of prices contains two opposite eras. The oil shocks of the 1970s demonstrated the vulnerability of a resource-importing economy. Later, the bursting of the late-1980s asset bubble, corporate and bank balance-sheet repair, the 1997 consumption-tax increase, the Asian financial crisis and banking stress weakened demand. By the late 1990s, Japan had entered sustained price decline.
The BOJ’s 2024 broad review described price stability as a challenge lasting roughly 25 years. The Bank introduced the zero-interest-rate policy in 1999, quantitative easing in 2001 and comprehensive monetary easing in 2010. In April 2013, under Governor Haruhiko Kuroda, it launched quantitative and qualitative monetary easing, greatly expanding the monetary base and purchases of government bonds and exchange-traded funds. Negative rates followed in January 2016 and yield-curve control that September.
| Period | Price and policy turn | Lesson |
|---|---|---|
| 1970s | Two oil shocks and severe imported inflation | External prices transmit powerfully through a resource-importing economy |
| Late 1990s | Deflation takes hold; zero rates arrive in 1999 | Weak growth and expectations of falling prices can reinforce each other |
| 2001–2006 | Quantitative easing targets current-account balances at the BOJ | Stabilizing finance does not easily lift price expectations |
| 2013–2024 | 2% target, QQE, negative rates and yield-curve control | Large-scale easing supports jobs and finance but can impair market function |
| March 2024 | Negative rates and yield-curve control end | A prospective wage-price cycle becomes the test for normalization |
| June 2026 | Short-term policy-rate guideline rises to 1.0% | The BOJ manages present core inflation below 2% and future upside risk together |
Was the inflation after 2022 the 2% Japan wanted?
Post-pandemic supply constraints, commodity inflation, Russia’s invasion of Ukraine and a weaker yen delivered the inflation that Japan had lacked—abruptly and painfully. Companies passed through higher material and logistics costs, led by energy and food. But imported costs that reduce real household income are not the same as the desired 2% generated by demand and rising incomes.
That distinction helps explain why the BOJ waited until March 2024 to exit its extraordinary framework. It judged that a virtuous cycle between wages and prices had come into sight, ended negative rates and yield-curve control, and returned to short-term interest rates as its main policy tool. Subsequent increases have tested whether wage- and price-setting behavior will avoid reverting to Japan’s old zero norm.
Wages have finally begun to outrun prices
The Labor Ministry’s preliminary May survey showed total cash earnings rising 3.2% from a year earlier and scheduled pay rising 3.0%. Real wages increased 1.4%, their fifth consecutive gain. After years in which purchasing power eroded, this is a meaningful change. If pay persistently exceeds inflation, households can absorb price changes while consuming, and firms can sustain wage and price increases driven by labor scarcity.
Average wages and the spring shunto results do not reach every worker at the same speed. Employees of large companies, workers at small firms, nonregular staff and pensioners experience different income paths. Real household spending among two-or-more-person households fell 0.4% in May from a year earlier. Rising wages do not instantly create strong consumption; accumulated price increases, housing, education and uncertainty still influence behavior.
June’s consumer-confidence index edged up 0.2 point to 33.8, while willingness to buy durable goods remained a weak 24.6. At the same time, 93.3% of surveyed households expected prices to rise over the next year. Statistical inflation of 1.6% can coexist with a widespread expectation of further increases.
Upstream 7.1%, downstream 1.6%: pressure inside company accounts
The BOJ’s June Producer Price Index rose 7.1% from a year earlier and 0.4% from May. Petroleum and coal products were up 22.8%, nonferrous metals 39.2% and chemicals 14.4%. Prices in transactions between domestic companies were rising far faster than consumer prices. The yen-basis Import Price Index was 29.7% above a year earlier.
Producer inflation does not pass one-for-one into CPI. Companies buy time through contracts, currency hedges, inventories, productivity, supplier negotiation and lower margins. In competitive markets, small firms may absorb costs they cannot pass on. When that capacity runs out, retail prices can rise months later. The gap between 7.1% upstream and 1.6% core consumer inflation is evidence of cooling—and a warning that potential increases may be accumulating on balance sheets.
How ¥163.84 per dollar reaches a Japanese price tag
Japan.co.jp’s reference rate of ¥163.84 per dollar was recorded at 1:38 p.m. Japan time on July 25, 2026. A weaker yen raises the local-currency cost of dollar-priced oil, liquefied natural gas, feed, edible oils, metals and electronics. The exchange rate does not, however, appear on a store shelf the next day.
Importers hedge currency, hold inventory and reset prices by quarter or half-year. Fuel policy smooths the wave reaching households. Yen effects arrive over months and then disappear from annual comparisons as the prior-year currency base changes. The BOJ does not target the exchange rate itself, but it must assess how the currency affects prices, expectations and wages.
Why the BOJ raised its policy rate to 1%
On June 16, the BOJ raised its guideline for the uncollateralized overnight call rate to around 1.0%. That decision came before the June CPI release, and policymakers already expected near-term core inflation in the mid-1% range. In testimony to the Diet, Deputy Governor Ryozo Himino said government energy relief was holding the current rate down, while higher oil prices could push inflation clearly above 2% through energy and goods.
In its April Outlook, the median Policy Board forecast for CPI excluding fresh food was 2.8% in fiscal 2026, 2.3% in fiscal 2027 and 2.0% in fiscal 2028. The path assumed a substantial effect from the Middle East situation and crude oil and is necessarily uncertain. Monetary policy acts with a delay, however, so waiting until an upside risk is fully visible can mean acting too late.
Rate increases also restrain demand through mortgages, business loans and government financing costs. Interest rates cannot produce oil; using them too aggressively against imported inflation can weaken investment and consumption without fixing the external shortage. The BOJ must ignore temporary waves while preventing them from becoming persistent through wages and expectations—a narrow channel between two errors.
In August, the measuring stick itself changes
The June report used the 2020-base CPI. The Statistics Bureau is moving to a 2025 base. It plans to release recalculated data from January 2025 through June 2026 on August 7 and begin monthly publication on the new base on August 21. As household spending patterns change, item weights must change with them. New weights for communications, energy, food and services may alter recent annual rates slightly.
Rebasing does not undermine the statistics; it keeps the basket aligned with contemporary life. It does mean that the June 1.6% reading should be recorded as one of the last major national releases under the 2020 base when making long historical comparisons.
What to watch at the July 30–31 meeting
The BOJ is scheduled to meet July 30 and 31 and publish a new Outlook Report. The important question goes beyond a one-day rate decision: will the Bank retain April’s 2.8% fiscal-2026 forecast, and how will it recombine oil, the yen, subsidies and wages?
- Underlying trend: Are service prices and wages moving together toward 2%?
- Pipeline: How much of the 7.1% producer-price rise will reach consumers?
- Policy: How would extending or ending fuel and education relief alter CPI?
- Income: Will real-wage gains spread to small firms, nonregular workers and regions?
- Currency: Will a yen near 164 per dollar accelerate expectations and price revisions?
Three broad paths are possible. Oil and yen pass-through could lift core inflation back above 2% in a reacceleration. Food and services could cool, leaving inflation in the 1% range in a soft landing. Or producer costs could remain high while consumption weakens, squeezing profits and real income in a bad stagnation. The appropriate policy would be different in each case, even if all begin from the same 1.6%.
Japan needs neither a cheap country nor an expensive one
During deflation, unchanged price tags looked like stability. Behind them, wages, investment and nominal growth stagnated; companies avoided visible increases by reducing quantities and restraining labor costs. After 2022, imported inflation struck households first and wages followed later. Neither condition is the sustainable 2% outcome policymakers sought.
Price stability worth having is a state in which companies raise productivity and pay, household income outpaces prices, regular price revision no longer produces shock, and monetary policy works through ordinary interest rates rather than permanent emergency measures. June’s 1.6% neither proves Japan has left that path nor confirms that it has arrived.
The number describes several economies at once: surface inflation has cooled; food remains expensive; a new cost wave is pressing on producers; wages have finally begun to catch up; and policy support is masking part of the energy bill. Japan’s inflation debate cannot end at whether a line is above or below 2%. It turns on whose income rises, who absorbs the costs, and whether wages and demand can sustain price stability after temporary supports disappear. That answer will define the shape of Japan’s post-deflation economy.
Principal sources and methodology
This article cross-checked the Statistics Bureau’s June 2026 CPI release and detailed tables with the BOJ’s price-stability framework, underlying-inflation methodology, April Outlook, June policy explanation and producer prices, as well as official wage and consumer surveys. It distinguishes year-on-year from month-on-month change, price level from inflation rate, and policy-driven reductions from demand-driven movement. June CPI uses the 2020 base; recalculated 2025-base history is scheduled for August 7.
- Statistics Bureau: nationwide CPI for June 2026
- Statistics Bureau: detailed CPI, contributions and policy-effect estimates
- Statistics Bureau: CPI methodology and 2025-base revision schedule
- Bank of Japan: Price Stability Target of 2 Percent
- BOJ Review: The Concept and Measurement of Underlying Inflation
- BOJ: Highlights of the April 2026 Outlook Report
- Deputy Governor Himino: June rate decision and price outlook testimony
- BOJ: June 2026 Corporate Goods Price Index
- Ministry of Health, Labour and Welfare: May 2026 Monthly Labour Survey
- Statistics Bureau: May 2026 Family Income and Expenditure Survey
- Cabinet Office: June 2026 Consumer Confidence Survey
- BOJ: Unconventional Monetary Policy Measures from the Late 1990s
- BOJ: Changes in the Monetary Policy Framework, March 2024
- BOJ: Review of Monetary Policy from a Broad Perspective
- BOJ: July 2026 release and meeting schedule