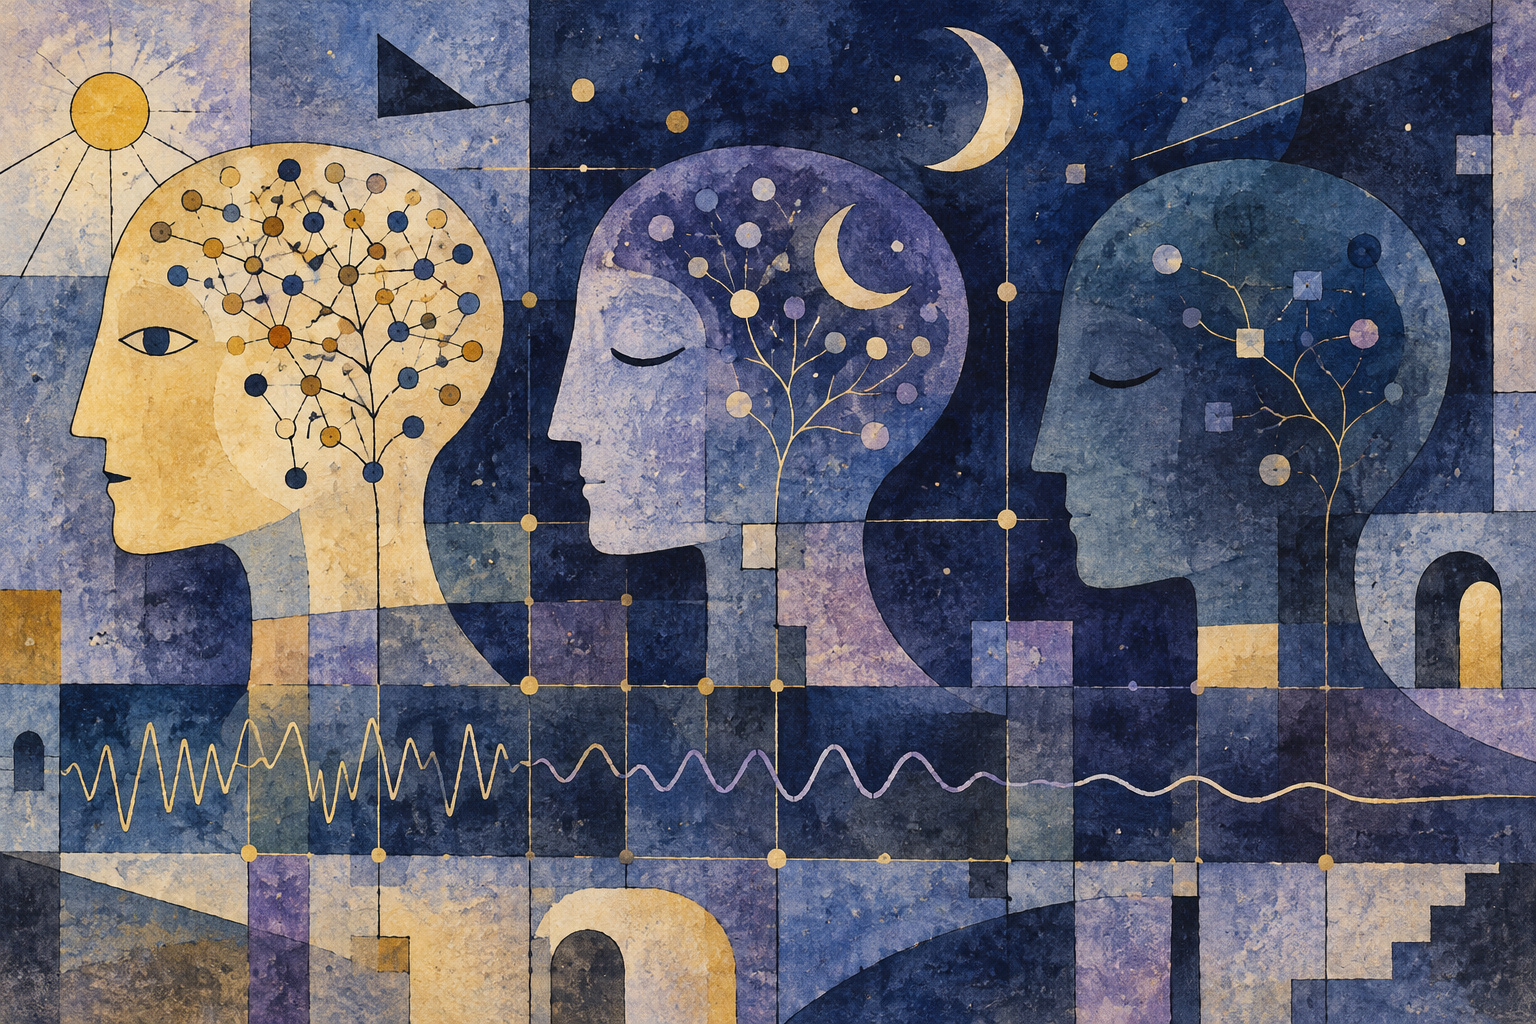
A sleeping brain is not simply an awake brain switched off. Cells continue to act, but the organization of their activity changes. Understanding that organization requires seeing many individual neurons at once—and knowing which state the animal was in when each signal was recorded.
A Japanese research team has opened a substantial collection of those recordings to other researchers. Announced by RIKEN on September 15, the resource brings together mouse cortical activity during wakefulness, natural sleep and isoflurane anesthesia. Its data descriptor appeared in Scientific Data on September 10. Crucially, the release includes original microscope images and accompanying brain-wave and muscle recordings, not only the processed neuronal signals.[1]
This is a research resource, not a demonstration that consciousness has been decoded. Its immediate contribution is practical: laboratories can investigate the same recordings with different questions and methods, including laboratories that do not own the specialized microscope used to produce them.
The authors are Ikumi Oomoto and Masanori Murayama of RIKEN, and Daiki Kiyooka and Masafumi Oizumi of the University of Tokyo. The Japanese announcement identifies Murayama as team director and Oizumi as associate professor. Their collaboration brings experimental recording and quantitative analysis together.[1]
A large cellular view, with defined boundaries
The paper describes ten recording sessions: six covering wakefulness and sleep, and four covering wakefulness and anesthesia. Each session contains roughly 4,000–10,000 quality-controlled neuronal signals, recorded across a field about 3 millimeters square at 7.65 frames per second. These are mouse cortical recordings, not a human dataset or a whole-brain movie.[2]
RIKEN describes the collection as world-leading in scale. That is the institution’s characterization, rather than an independently established ranking of every neuroscience database. The useful combination is cellular resolution, coverage spanning neighboring cortical areas, and physiological information with which to identify brain states.[1]
Thousands of neurons also do not mean thousands of independent animals. Cells within one mouse share physiology and experimental conditions. The accompanying laboratory tutorial explicitly treats the biological mouse, rather than each time window, as the replicate for comparisons across animals. A large number of measurements can illuminate a small sample in detail without making that sample broadly representative.[5]
What the light actually measures
The method is calcium imaging with a wide-field two-photon microscope. Activity-related changes in intracellular calcium alter the brightness of a fluorescent indicator. Images locate individual cells; changes in brightness provide their time series. The technique links where a neuron is with how its signal develops over time.[3]
It does not directly record each electrical action potential. The released representations distinguish measured fluorescence changes from computational estimates of spiking and from smoothed estimates. Those distinctions matter whenever a researcher interprets timing, coordination or the apparent strength of a relationship between cells.[2]
| Material | What it supports | Interpretive boundary |
|---|---|---|
| Original microscope images | Revisit cell detection and image processing | Brightness is not a direct electrical recording |
| Processed neuronal signals | Examine activity and relationships between cells | Estimation and smoothing choices matter |
| EEG, EMG and state annotations | Relate cellular activity to brain state | Inspect classification and available duration |
| Spatial annotations | Study how activity relates to location | Functional relationships do not prove direct wiring |
Imagine two algorithms analyzing the same faint fluctuation. One retains it as a neuronal event; another rejects it as noise. Their downstream networks may differ even though they started with identical images. Access to the original recording allows that disagreement to be investigated instead of hidden inside a final graph.
Why brain waves and muscle signals belong beside the images
A motionless animal is not necessarily asleep. Interpreting cellular activity requires an independent account of state, which is why simultaneous electroencephalography, or EEG, and electromyography, or EMG, are valuable. Their timing can be aligned with the microscope frames rather than inferred from the fluorescence alone.
The sleep annotations distinguish wakefulness, quiet wakefulness, non-REM sleep and REM sleep. The methods describe manual corrections where immobile wake periods under head fixation had initially been classified as REM. An annotation is thus an evidence-based judgment made through a procedure, not an infallible label delivered directly by nature.[2]
The presence of a state in a dataset also says little about how much usable material it contains. A brief REM interval cannot support every comparison that a long, stable recording could. Before choosing a model or statistical test, a reuser needs to inspect the durations and distribution of the states relevant to the question.
The path from a new microscope to a shared resource
The work follows an identifiable technological progression. In April 2021, RIKEN and its partners announced FASHIO-2PM, a microscope designed to combine a broad field with the resolution needed to distinguish cells. They reported recording more than 16,000 neurons within a single 9-square-millimeter field. The engineering challenge was to observe neighboring cortical areas without losing the individual cells inside them.[3]
That earlier demonstration should not be confused with the number of retained cells in the present release. Instrument performance, cells initially detected in an image, and signals meeting a particular quality standard are different quantities. A reusable dataset needs to document those distinctions as carefully as its most impressive number.
In February 2026, the group reported that functional networks inferred from these kinds of recordings were more segregated into modules during non-REM sleep and anesthesia than during wakefulness. The new descriptor organizes the recordings associated with that earlier work for reuse. September’s news is the documented resource, not a second announcement of the February finding.[4][2]
A functional connection is not a photographed wire
Here, a network describes relationships inferred from activity. Similar timing between two cells does not, on its own, prove that one directly connects to or drives the other. Both could respond to a shared input. Keeping statistical relationships separate from anatomical wiring is essential when interpreting a network diagram.
The laboratory’s tutorial makes the construction of such diagrams inspectable: it moves from signals through correlations to graphs and modules. It also explains why edge density is matched across conditions. Otherwise, a comparison could partly reflect how many links the analyst kept rather than the physiological difference under investigation.[5]
Japan.co.jp’s assessment is that this is where a common dataset becomes especially useful. Competing methods can be tested against the same observations. Researchers can ask whether a pattern survives different processing choices, rather than attributing every disagreement to different animals or recording equipment. Openness creates opportunities to challenge an interpretation as well as to reproduce it.
Sleep and anesthesia are not interchangeable controls
The paper cautions that the sleep and anesthesia recordings differ in animal-age ranges and circadian recording phases. The preparation also involves head-fixed mice and superficial cortical sampling. It is not a survey of freely moving animals, all brain structures or all anesthetic drugs.[2]
Consequently, a difference between the two recording paradigms cannot automatically be assigned entirely to sleep versus anesthesia. Other conditions may contribute. Comparing changes within a recording and comparing pooled groups answer different questions and require different assumptions.
The same restraint applies to consciousness. A computational classifier that separates labeled states would show that it detects differences in these recordings. It would not, by that achievement alone, reveal an animal’s subjective experience. Moving from this mouse resource to a human clinical assessment would require separate evidence and validation; the release does not establish a diagnostic test or a bedside anesthesia monitor.
Open access is the beginning of reproducibility
The data are identified by accession 20260708-001 on the CBS Data Sharing Platform. The paper and laboratory documentation describe their organization and reuse. The platform’s general policy provides for reuse of open data under CC BY 4.0 with attribution, while software can have separate licensing terms. Researchers should identify the actual files and applicable terms they use.[6][7]
A reproducible analysis should also preserve the dataset version, the selected cells and time periods, exclusion decisions and processing settings. Starting from raw images is a different exercise from using the authors’ processed signals. Both can be useful, provided the route to the result remains visible.
For method development, one further distinction matters: a system that performs well on familiar recordings may not work on another animal or recording setup. Independent evaluation should be designed around that question. Large files and impressive accuracy figures cannot replace a meaningful test of generalization.
The durable contribution of this release is a shared starting point. The microscope extended what one experiment could observe. Making its records available extends who can question the observations, revisit the assumptions and search for a better explanation of how the active brain changes state.
- RIKEN: Release announcing the brain-state dataset, September 15, 2026
- Oomoto et al.: Multi-area single-cell calcium imaging dataset of the mouse cortex across wakefulness, sleep, and anesthesia, Scientific Data, September 10, 2026
- RIKEN and partners: Development of FASHIO-2PM, April 20, 2021
- RIKEN and partners: Earlier functional-network study, February 7, 2026
- Oizumi laboratory: Functional-network analysis tutorial and documentation
- RIKEN CBS Data Sharing Platform: Access and reuse policies
- Dataset landing page, accession 20260708-001; contents documented by the paper and laboratory
- Brain/MINDS 2.0: Dataset announcement, September 15, 2026
Research details are based on published materials. Interpretation and methodological discussion are Japan.co.jp analysis. We did not independently reanalyze the full dataset.