- The dark water inside a planetary mystery
- Why the 2023 numbers were extraordinary
- An energy imbalance hidden in color
- An unusually windy November set the sequence in motion
- The revealing opposite: the summer of 2008
- A half-century of satellite observation—and a Japanese research trail
- Why sea ice matters beyond Antarctica
- What this paper does—and does not—settle
- The earliest cracks may hold a forecasting clue
The dark water inside a planetary mystery
At the end of the Southern Hemisphere's summer in February 2023, the floating sea ice surrounding Antarctica retreated to a satellite-era low. Scientists knew the extent of the loss. Explaining why that particular summer produced so little ice was another matter. Winds, the temperature of the upper ocean, sea-ice thickness and the energy entering the ocean all interact across an enormous and difficult-to-observe region.
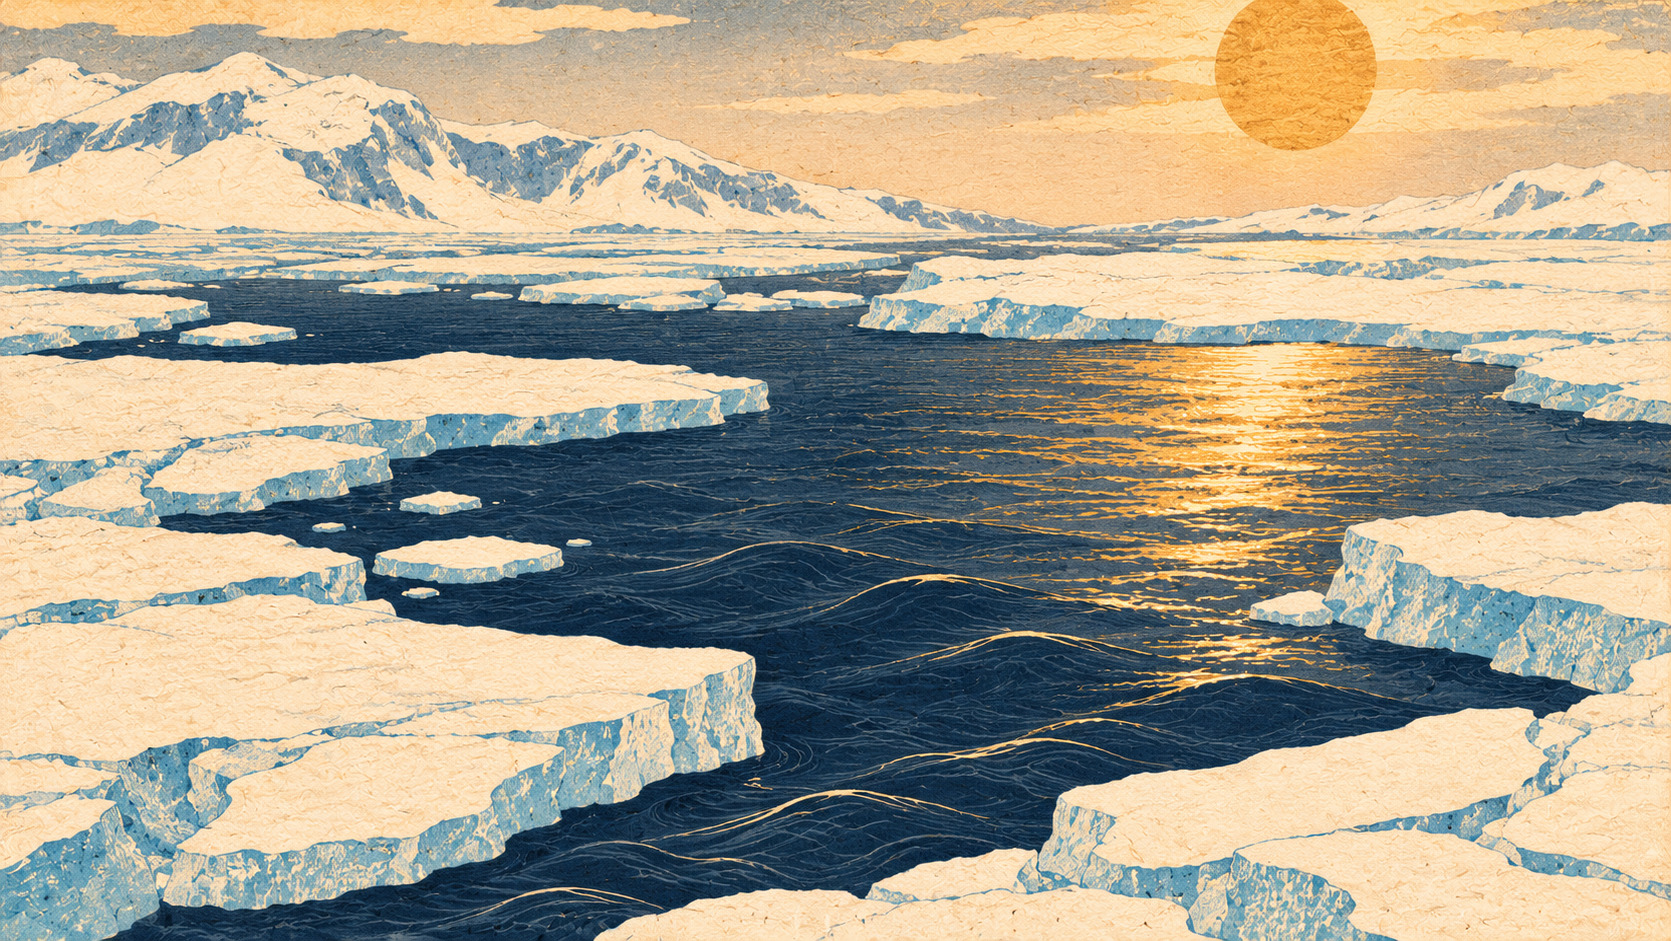
A new study from Japanese researchers proposes an amplifying mechanism. Strong early-season winds spread the sea ice apart, exposing darker water between the floes. That water absorbs sunlight that brighter ice would largely reflect. As the upper ocean warms, additional ice melts, exposing still more water and enabling further solar absorption.
The study, published on November 10, 2026 in the peer-reviewed journal Scientific Reports and announced by Hokkaido University and the National Institute of Technology, Tomakomai College on November 12, identifies ice–ocean albedo feedback as a key contributing process. It does not claim that this single mechanism explains every component of Antarctic change.
Why the 2023 numbers were extraordinary
The US National Snow and Ice Data Center estimated that Antarctic sea-ice extent fell to approximately 1.79 million square kilometers on February 21, 2023, the lowest annual summer minimum in the satellite record at that time. Later that year, winter's annual maximum reached about 16.96 million square kilometers on September 10, also the lowest such maximum in the record. These refer to two different points in the seasonal cycle, not to a single uninterrupted measurement.
“Extent” is not identical to the precise area of ice itself. The standard satellite metric counts ocean grid cells whose ice concentration exceeds a specified threshold. It enables consistent comparisons over decades but should not be casually interchanged with ice area, ice mass or thickness.
The geography is important. Arctic sea ice occupies an ocean enclosed by continents. Antarctic sea ice forms around a continent and can be redistributed over the open Southern Ocean. While Arctic summer ice declined dramatically over recent decades, Antarctica showed no equivalent sustained decrease through the mid-2010s. A downward shift after roughly 2016 intensified the search for explanations.
An energy imbalance hidden in color
Albedo is the fraction of incoming solar radiation reflected by a surface. According to the Japanese university's explanation, snow-covered sea ice can reflect roughly 70–80% of sunlight; open ocean water reflects only around 6–7%. The remainder available for absorption is dramatically different. Those figures are illustrative of the contrast rather than fixed values for every angle of sunlight, snow condition or sea state.
Once an opening appears in the ice, sunlight can heat the upper layer of water. That heat can melt the sides and undersides of adjacent ice, enlarging the opening. The newly exposed water then absorbs more radiation. In climate science, a positive feedback is a process that amplifies an initial change; “positive” is not a moral or beneficial judgment.
This mechanism depends on the season. An opening formed by wind in a cold Antarctic winter may lose heat rapidly and freeze again. Near the start of the melt season, strengthening sunlight changes the balance. What looks like a modest movement of ice can become a gateway for additional energy entering the ocean.
An unusually windy November set the sequence in motion
The researchers, Sohey Nihashi of Tomakomai College and Kay I. Ohshima of Hokkaido University's Institute of Low Temperature Science, combined satellite sea-ice measurements with atmospheric reanalysis, heat-budget calculations and a simplified coupled sea-ice–ocean model. Their key measure was wind-driven divergence: the tendency of ice to move apart and increase the amount of exposed water.
The paper reports that the cumulative wind-driven divergence index during November 7–16, 2022 was the highest in the 43-year period analyzed. A greater open-water fraction followed, accompanied by stronger solar heat input to the ocean during December. By February 2023, the summer ice minimum was exceptionally low. The research presents the seasonal sequence as evidence that early-melt-season winds can initiate an important feedback.
This was not a laboratory experiment that directly controlled the winds over Antarctica. The authors examined the observed relationships and used a model to test whether the proposed physical process could reproduce the broad differences. That combination strengthens the argument while leaving room for other causes and local variation.
The revealing opposite: the summer of 2008
The researchers compared the extreme 2022–23 season with 2007–08, when Antarctic summer sea-ice extent was unusually high. In that earlier season, wind conditions were less favorable for exposing open water during the early melt period, and solar heat uptake through those openings was comparatively limited. The contrast provides a test of the proposed mechanism under markedly different conditions.
The authors built a simplified model linking ice concentration, motion and heat exchange with the upper ocean. It qualitatively reproduced differences between the two seasons, as well as features of the recent summer decline. It was designed to isolate a mechanism, not to reproduce every eddy, local ice-thickness measurement or atmospheric process in the Southern Ocean.
Sensitivity experiments varied initial ice thickness. Thinner ice predictably retreated sooner, but changing thickness alone did not erase the key difference between the contrasting years. The result does not disprove the influence of warming subsurface waters. It suggests that wind-triggered solar heating deserves greater attention alongside that influence.
A half-century of satellite observation—and a Japanese research trail
Antarctic sea ice became far easier to compare across years when satellite observations began delivering near-continuous regional coverage in the late 1970s. Ships and instruments placed in the ocean remain essential, but no vessel can survey the entire changing ice margin daily. Satellite records made it possible to identify the 2023 anomaly against decades of seasonal patterns.
Remote sensing alone cannot reveal all the heat stored beneath the surface or all the mechanics that determine whether a floe melts. Observations of the ocean, atmospheric reanalyses and models are needed to connect the visible ice edge to the invisible flows of energy. The current study draws its argument from precisely this combination.
Its Japanese authors had explored related feedback in Arctic summer sea ice in work publicized by Hokkaido University in 2017. Their Antarctic analysis is not a simple transplantation of an Arctic explanation: it tests how the same basic contrast between reflective ice and absorptive water operates within the Southern Ocean's particular wind-driven seasonal cycle.
Why sea ice matters beyond Antarctica
Floating sea ice regulates how the ocean exchanges heat and moisture with the atmosphere. Its formation and melting also influence salinity and the conditions involved in dense-water production around Antarctica. Changes in that system matter because the Southern Ocean helps connect global flows of heat and carbon.
Sea ice must also be distinguished from land-based ice sheets and floating ice shelves. Melting floating sea ice does not have the same direct sea-level effect as adding meltwater from ice resting on land. It can, however, interact with waves, ocean conditions and ice-shelf environments. Claims that a specific Antarctic sea-ice loss directly equates to a particular sea-level rise would be misleading.
The changing ice environment may affect ecosystems that depend on seasonal ice, but ecological responses differ by region and species. This study investigated the physics of ice and heat exchange; it did not directly measure penguin populations, krill abundance or fisheries effects.
What this paper does—and does not—settle
It would be inaccurate to conclude that the Sun suddenly became stronger in 2023, or that sunlight alone caused the record minimum. The important change was in the surface exposed to incoming radiation. Winds created openings; dark water absorbed more energy; melting enlarged the openings. Upper-ocean warming, broader atmospheric circulation, initial ice conditions and other processes remain part of the scientific picture.
The authors call ice–ocean albedo feedback one of the key contributing mechanisms. Their model provides a qualitative account of certain patterns, not a universal forecast for future Antarctic ice conditions. They also acknowledge limited years of post-2016 data and the difficulty of determining statistical significance for shorter subperiods.
Uncertainty also arises from the sparsity of direct ocean measurements beneath and around Antarctic ice. Better satellite products, ice-thickness measurements, ocean observations and fully coupled climate simulations will be needed to quantify the relative importance of the different mechanisms.
The earliest cracks may hold a forecasting clue
The practical scientific question is whether monitoring wind-driven ice divergence in November could improve understanding of the ice conditions that will emerge later in the Antarctic summer. If a small opening changes the solar energy budget sufficiently to reinforce its own growth, observations at the beginning of melting may be especially informative.
The next stage, according to the researchers, is to examine the feedback in more sophisticated coupled models and assess how it interacts with the global climate system. Better knowledge of a mechanism is not the same as proven high-accuracy seasonal prediction, and the results should not be advertised as a ready-made operational forecasting system.
The news in November 2026 is the explanation—not the 2023 event itself. A record that once appeared as a stark line on a satellite chart now has a more detailed physical story: winds moved the ice, exposed ocean captured sunlight, and the resulting warmth may have helped drive the remarkable retreat. It is a reminder that in a complex climate system, the earliest changes can matter long before the final record is set.
Primary sources and reporting limitations
Based on the institutional release, peer-reviewed paper, NSIDC and other public records. No original scientist interviews or Antarctic field visit were conducted. The model provides a qualitative mechanism, not a single-cause explanation or operational forecast.
- 北海道大学・苫小牧工業高等専門学校:研究発表(2026年11月12日)
- 北海道大学:共同プレスリリースPDF(手法・図・用語解説)
- Nihashi & Ohshima (2026), Scientific Reports, original peer-reviewed article
- DOI: 10.1038/s41598-026-70282-2
- NSIDC: 2023 Antarctic summer minimum
- NSIDC: 2023 Antarctic winter maximum
- NASA Earth Observatory: 2023 record low growth
- WMO: Antarctic winter sea-ice record, September 2023
- 苫小牧工業高等専門学校:二橋創平教授の所属・氏名確認
- 北海道大学:2017年北極の海氷減少メカニズムに関する先行研究