329 is the beginning of a maintenance obligation
PLATEAU Vision 2026, released July 17, says 329 cities had 3D city models by the end of FY2025 and roughly 100 use cases had been developed. The 2020 launch year produced 56 city models and 44 use cases. The government now targets 500 cities by the end of FY2027.
The scale matters. From Sapporo to Naha and from metropolises to towns and villages, a common machine-readable approach differs from a collection of isolated smart-city pilots. Users can do more than view PLATEAU VIEW: they can download data and use it for analysis, research, games and commercial services.
Yet obsolescence begins the instant a model is produced. Buildings appear, disappear and change use. Roads and defenses change; disasters alter terrain. A city count only becomes meaningful beside the model date, geographic coverage, quality, updating responsibility and actual use.
A 3D map is not automatically a digital twin
A conventional 3D map displays urban form. A digital twin maps real objects and conditions into a virtual environment, receives real-world information, supports analysis or simulation and returns insight to real decisions. Continuous real-time synchronization is not mandatory in every definition, but the idea implies a loop broader than a handsome model.
PLATEAU's standardized 3D city models are static or periodically updated public foundations for that loop. A building is represented not merely as geometry but as a building object that can hold use, structure, storeys and height. Roads, bridges, land use, planning zones and hazards can occupy the same spatial system. National specifications and openness are the project's strongest features.
The official 329 therefore means 329 municipalities with some model development. It does not mean every one has complete territory, equal precision, current data, sensor synchronization or routine operational use. “Digital twin” describes PLATEAU's destination; it should not erase different maturity levels.
LOD: visual detail has a price
Models are described by levels of detail, or LOD. In simplified terms, LOD1 is a building footprint extruded into a block, LOD2 includes roof shape, and higher levels can represent façades, openings or interiors. Not every building or city has the same LOD.
A block may be sufficient to compare flood depth with buildings across an entire municipality. Landscape review, shadow, radio propagation, evacuation and indoor-outdoor routing may require roofs, façades, entrances or internal space. Added detail increases survey, point-cloud, photography, attribution, validation, delivery and computing costs.
Vision 2026's shift toward “necessary and sufficient” quality is therefore important. Alongside high-quality standard models, PLATEAU will encompass partially attributed models, models made with AI and other technology, and related BIM and point-cloud data. The aim is not indiscriminate degradation but avoiding public expense on precision a decision does not need.
Japan already possessed a paper anatomy of its cities
PLATEAU did not emerge from an empty sky. Municipalities have long conducted urban-planning basic surveys covering buildings, land use, development and transportation. Property tax, building confirmation, road ledgers, hazard maps and the Geospatial Information Authority's fundamental data record the city under separate institutions.
For decades these were islands divided by departments, years, formats, coordinates and access rights. GIS made two-dimensional overlay possible, but a shared standard for a building as one meaningful object across datasets remained limited. PLATEAU joins aerial and other geometry to meaning from existing administrative records and expresses it as reusable urban objects centered on CityGML.
This is administrative cleanup as much as model production. It exposes inconsistent names, missing attributes, obsolete uses and boundary conflicts. The deepest value of three-dimensional conversion may be a shared cross-department dictionary of the same city.
CityGML turned a house from an image into data
CityGML, developed through the Open Geospatial Consortium, represents both urban geometry and semantics. Buildings, roads, bridges, vegetation and water are distinct objects with attributes and relationships. PLATEAU created Japanese extensions, product specifications, work procedures and quality methods needed for planning and disaster policy.
A game mesh can be visually magnificent yet make it difficult to ask automatically, “What is this building used for?” or “How many buildings sit within this flood zone?” Semantics allow one foundation to be reused for disaster management, planning, environment and mobility.
CityGML can also be complex and heavy. PLATEAU has developed 3D Tiles and GIS conversions, tools, SDKs, VIEW and open code. The semantic standard acts as the spine for preservation and exchange; lightweight formats serve as muscles for web delivery and rendering.
A national project launched in the pandemic year
Project PLATEAU began in FY2020 amid Japan's Society 5.0, smart-city, resilience and administrative-DX agendas. The pandemic added urgency to understanding movement, density and public space with data. The first year released 56 models and 44 use cases.
A 2023 vision declared a shift from demonstration to implementation and introduced municipal subsidies. Coverage reached roughly 250 cities in FY2024, with additional private-sector support, then 329 at the end of FY2025.
The pace came from packaging specifications, guides, a viewer, open data, use cases, training and competitions at national level. That produced more interoperability than hundreds of proprietary local replicas. It also created a demonstration cliff: after an initial model is subsidized, whose operating budget keeps it current?
Why three dimensions matter in a disaster country
A two-dimensional flood map marks a hazard zone. A 3D view places the water surface beside terrain and buildings, helping a resident understand which floor may be affected and allowing government to combine building use, population, care facilities and shelters.
The vision proposes municipality-wide urban-fire spread simulations in Fujisawa and elsewhere to review fire-prevention zones and fire-unit deployment. Terrain, building properties, vegetation and weather can support scenarios rather than static coloring. After a disaster, imagery and field reports can be compared with the baseline to accelerate damage assessment and reconstruction planning.
A model is not a prophecy. Flood, fire and earthquake results depend on inputs, assumptions, resolution and uncertainty. The persuasive realism of 3D can cause precision to be mistaken for accuracy. Scenario limits, data dates, uncertainty and excluded hazards need equal visual prominence.
From disaster demonstrations into permits and routine work
PLATEAU's next phase aims at daily municipal work. Vision 2026 uses Kisarazu as a starting point for one-stop development-permit suitability checks, pre-consultation, applications and post-approval processes. Utsunomiya and other cities are positioned to use quantitative urban-structure assessment in location-optimization planning.
Kurashiki is advancing 3D sightline and landscape tools for outdoor-advertising review, reducing site visits and improving discussions. Taxation, underground utilities, rivers, embankments, public-facility placement, heat, movement, congestion, drones and autonomous vehicles are all proposed fields.
The right metrics are not views or event attendees. They are permit time, site visits avoided, plans changed, resident comprehension, operating cost and error. A model shown in a meeting is not the same as a model embedded in a procedure and recurring budget.
A tool for shrinking cities
Japanese urban policy is shifting from expansion toward reallocation. Population decline, aging, empty homes, weakened transit and infrastructure renewal make uniform service levels increasingly difficult. Compact-plus-network policy seeks to connect residential, medical and commercial hubs through transport.
Combining population, use, vacancy, transit, medicine, terrain and hazard with a 3D city can compare facility consolidation or residential guidance scenarios. Sun, slope, walking distance and accessible routes are genuinely three-dimensional conditions in older residents' lives.
But an efficiency map does not neutralize politics. Which community to maintain, who bears relocation and how to value land or tax revenue are value choices. Model optimization must not replace consent. Assumptions should be public and residents should be able to test alternatives.
Update cost is the enemy of the beautiful model
The ministry openly identifies high production and update expense, quality that exceeds some needs and incomplete operational integration. A citywide high-LOD model can impress when delivered yet become a dangerous old map if no one can afford its upkeep.
Vision 2026 proposes satellite detection of changed areas, smartphone imagery and AI generation of form and texture, automated quality checks and selective updates instead of full reconstruction. It will connect BIM, point clouds and private data and invite actors beyond municipalities into maintenance.
AI lowers cost but introduces different errors: shadows mistaken for structures, simplified roofs and performance disparities in snowy, rural or dense environments. Generated data needs provenance, method, validation range, precision, confidence, review and correction history, and must remain distinguishable from surveyed data.
The minimum freshness label
Model and object dates; source records; coverage; LOD and attribute completeness; horizontal and vertical accuracy; AI use and confidence; last validation; known omissions; next update; and a correction route. Humans and machines must be able to read “which reality, when.”
Open data may be Japan's international advantage
PLATEAU's defining choice is not locking taxpayer-funded models inside a viewer. Open data permits prototyping without a separate municipal contract, cross-city academic research and commercial development in games, insurance, logistics, real estate, tourism and environmental services.
Open specifications, code and guides reduce vendor lock-in. Small municipalities can reuse tools developed for large ones. Japan calls the system a digital public good and seeks international deployment through CityGML and OGC discussions, Indonesian urban projects and flood work in Ghana.
Free data alone does not create a market. Stable endpoints, versions, change notifications, APIs, examples, maintained open-source tools, support, trained staff and common procurement requirements are required. The permanent public foundation and the service layer capable of earning post-subsidy revenue must be distinguished.
A transparent city can become a surveillance city
Public building form and use are generally not personal data by themselves. Combined with detailed movement, device location, energy use, indoor BIM, cameras and vehicles, a dynamic twin can reveal behavior and vulnerability. Privacy and cybersecurity stakes rise with synchronization.
Open, government-restricted and sensitive-infrastructure layers should be separated, with controls for purpose, minimization, retention, re-identification, logging, transfers and incidents. Precise underground or critical-facility locations may aid disaster response and also attackers. Decisions not to publish require accountable explanation too.
Representation also has an equity dimension. If tourist and redevelopment districts are detailed while outskirts and poorer districts are coarse, investment and hazard analysis will follow the bias. Interfaces must distinguish absence of data from absence of an object, audit quality geographically and let residents submit corrections.
Reading the 2033 “100%” goals carefully
By March 2033, the vision targets a 100% update rate among cities whose source material is at least five years old, excluding those without substantial change. It also sets 100% for cities socially implementing selected service fields.
The latter requires a denominator and definition. The vision distinguishes implementation embedded in systems and workflows with continuing budgets, or used as evidence and consensus support, from trials. It does not mean all 329 cities adopt every service. The counting universe in subsidy programs and the consortium must be made transparent.
Good KPIs pair city counts and update rates with object freshness, departments using the model monthly, decisions changed, savings, resident participation, disaster outcomes, correction time and sustainable private revenue. The closer a target approaches 100%, the more its denominator, exclusions and auditor matter.
Twelve questions before a municipality buys
| Question | A good answer |
|---|---|
| Which decision changes? | A permit time, evacuation plan or site visit—not “visualization.” |
| What coverage, LOD and attributes are needed? | Derived from the use, not assumed citywide maximum detail. |
| What are the source and reference date? | Traceable by object and visible to users. |
| Who updates and when? | Named owner, budget, detection, validation and release schedule. |
| How are mistakes corrected? | Reporting, verification, versioning and notification. |
| How is uncertainty shown? | Assumptions, sensitivity, validation and exclusions. |
| Does it connect to GIS, ledgers and BIM? | Stable identifiers, APIs, conversion and no duplicate updating. |
| Can the city leave the vendor? | Full standard export, open tools and migration terms. |
| How are public and sensitive layers separated? | Risk tiers, access, logs and re-identification review. |
| Who can participate? | Low-end devices, disability, language and offline options. |
| What happens after subsidy? | Five-to-ten-year update, cloud, license, staff and training cost. |
| Who audits value? | Baseline, public KPIs, independent review and a stopping rule. |
The twin is not the city
PLATEAU has built a rare piece of Japanese administrative infrastructure. National specifications turn municipal records into meaningful 3D data; code and data are open; 329 cities share the framework; and use is aimed at disasters, decline, heat, traffic and landscape.
Vision 2026 also recognizes that the first success metric can become the next failure. Racing toward city counts accumulates update debt. Demanding maximum quality exhausts funds before use. Counting pilots leaves daily work unchanged. AI savings require new governance of provenance and error.
A map is power. What it depicts, omits and presents as an “optimal” future can redirect budgets, regulation, evacuation and development. A public twin should therefore include correction rights, contestability, transparent assumptions and civic participation—not data alone.
The real value of 329 is not a perfect miniature Japan. It is a common language in which cities can be inspected and alternative futures tested. Completion will not arrive at the 500th city. It will arrive when models become old, wrong and disputed—and correction becomes an ordinary act of government.
Primary sources and method
- MLIT release of PLATEAU Vision 2026, July 17, 2026 and full vision
- Official Project PLATEAU site and consortium and municipality information
- G-Spatial Information Center PLATEAU open-data portal
- PLATEAU Learning: 3D models, CityGML, LOD and use
- PLATEAU use-case catalog and specifications, technical reports and handbooks
- Open Geospatial Consortium CityGML standard
- Geospatial Information Authority of Japan: fundamental geospatial data
- MLIT urban-planning basic surveys
- Saitama City's local PLATEAU VIEW and model use
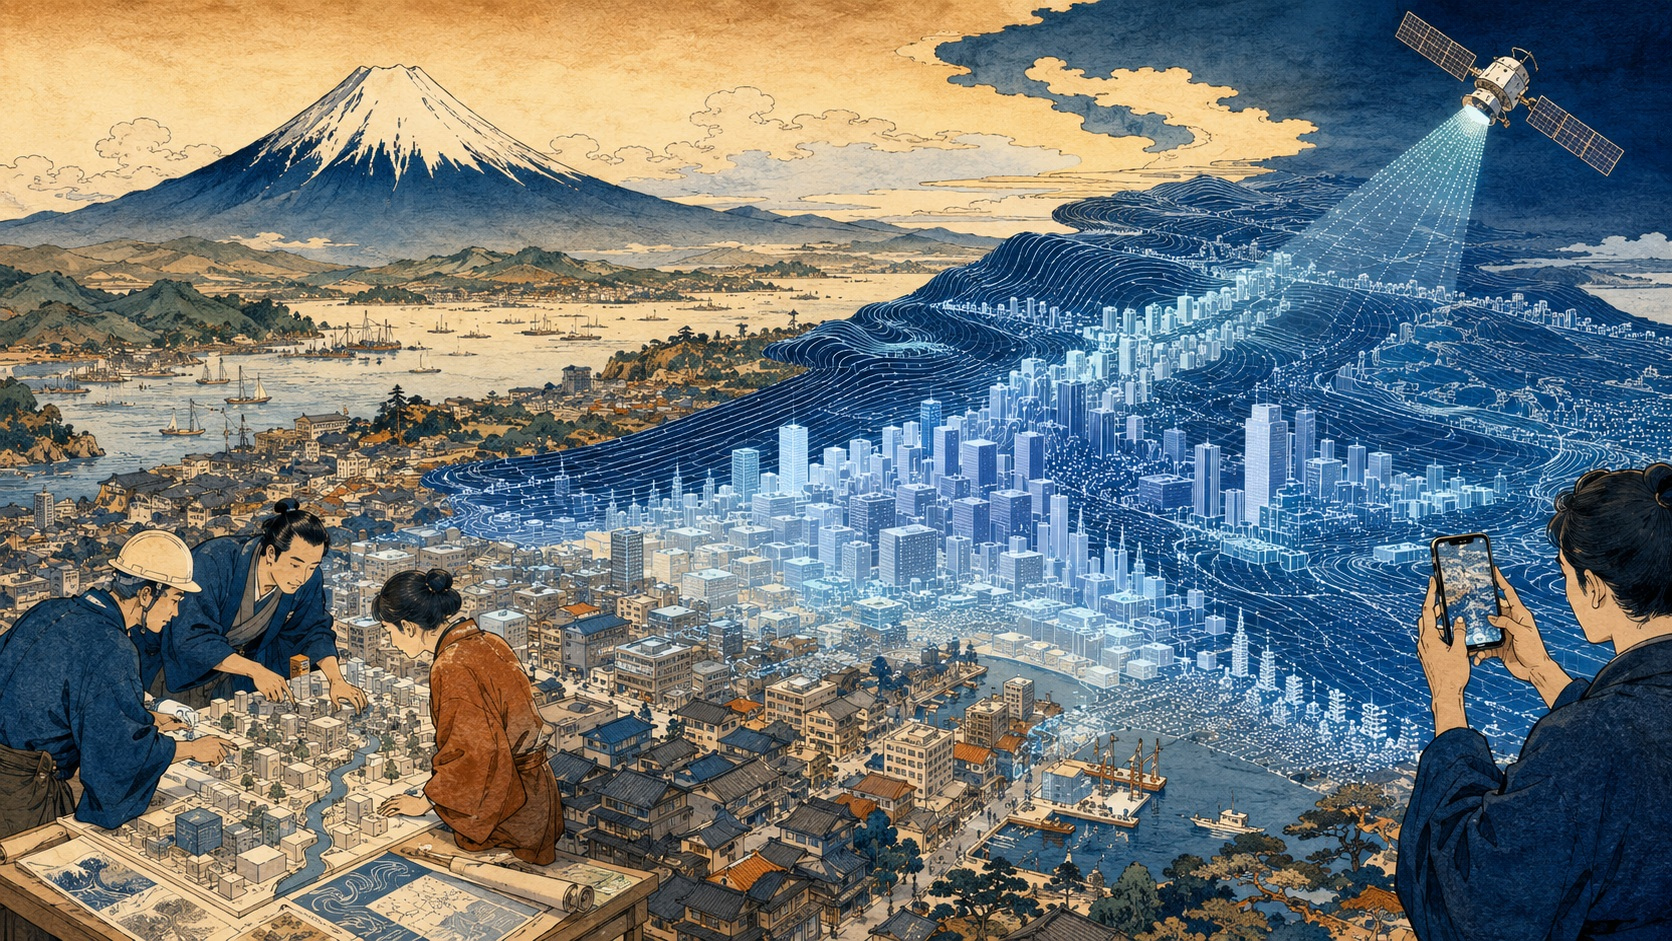
Editor's note: The 329 figure is MLIT's official count of municipalities with 3D city models at the end of FY2025. We do not treat coverage, LOD, attributes, source date, updating or real-time operation as uniform. Roughly 100 is a count of developed use cases, not a claim that all are permanent or independently validated. Targets of 500 cities and 100% updating and implementation are future goals. The release does not provide one audited total budget, city-level lifecycle cost, uniform usage rate or cost-benefit result; we do not infer those outcomes. Technical and policy judgments are editorial analysis. The exchange strip uses the supplied “1 US Dollar = 162.49 Japanese Yen.” The supplied July 21, 1:27 a.m. UTC timestamp converts to July 21, 2026, 10:27 a.m. JST. The image is a contemporary editorial illustration, not a historical Hokusai work or accurate PLATEAU data.